This project shows step-by-step how a fully featured analysis of Morris Water Maze experiment data is done within R.
At first the RTrack library was used to analyze metrics from the raw ethovision files that were available, then first simple plots of those experiment metrics and heatmaps of different experiment paradigms were created. With the RTrack package by Ruper Overall and his extensive documentation all of this can be done with a few lines of code and without much previous knowledge. If you are looking for a full guide how to use RTrack, take a look at the official documentation.
In my R-Analysis notebook I additionally explored the possibilites of ggplot2 and plotly and kept some errors I did in order to show some common mistakes and how to solve them.
The most important metrics we wanted to extract from the raw data were the strategy usages and how they differ between Strains, Age groups, Housing and all combinations of those. Therefore we once again used RTrack to predict the strategies used by the mice for each Trial. For each Trial we computed one of these tables, where the called strategy plus the confidence for all strategies are shown.

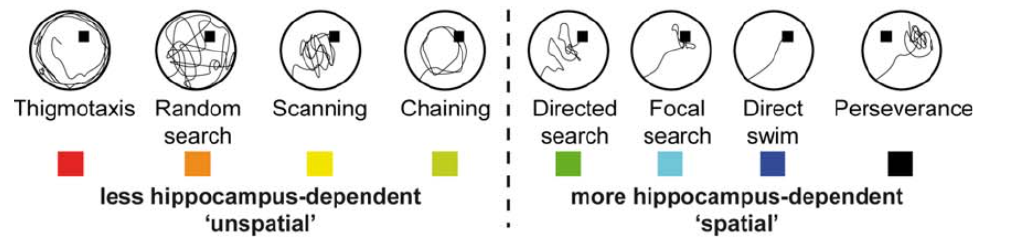
The Rtrack algorithm was exclusively trained with data from Morris water maze experiments with mice of different sex and genotypes, where multiple experts visually classified images of swim paths into different search strategies. Those 9 search strategies followed the scheme described at Rtrack Documentation - Strategy description and were classified at least twice until no discrepancies in the called strategies were left. Cases, in which the swim path could not be decided without doubt due to a mixture of strategies in one path or due to none of the 9 strategies being adequate, were discarded
We then assigned each track the strategy class 0 or 1 depending on their hippocampus-dependency. The assignment was done following figure 3 in Garthe et. al. 2016, where 'unspatial' strategies were labled with strategy class 0 and 'spatial' strategies were labled with class 1.
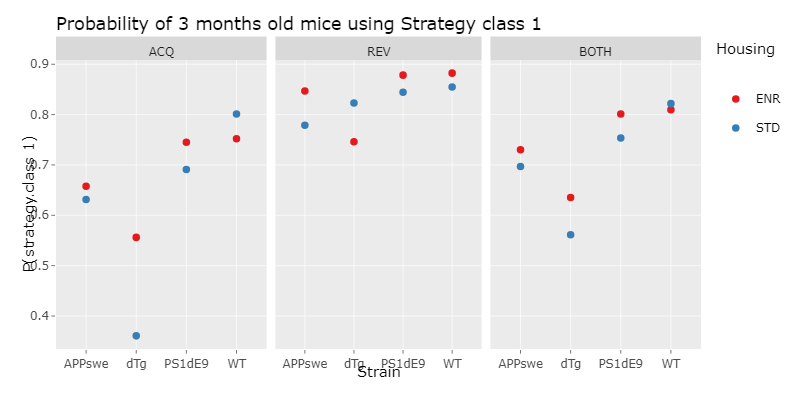
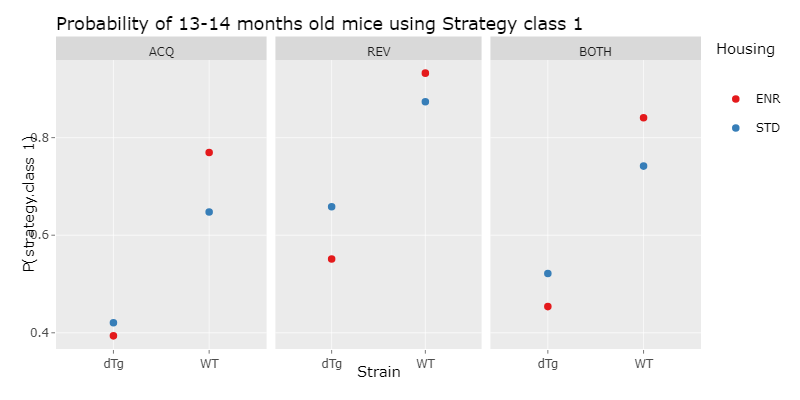
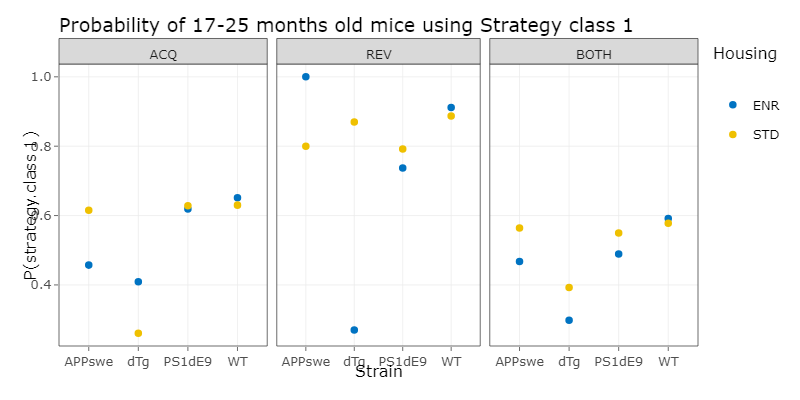
We´ve then done a logistic regression, which is a statistical model for a regression analysis. To do this, we first applied different logistic regression models with increasing complexity to our data and compared them using the ANOVA function. With this we choose the minimal adequate model, which is the simplest model, that describes the data appropiatly. With this model, we then could compute a prediction, which is the propability of a mouse of a specific experiment paradigm, choosing strategy class 1 and therefore using a hippocampus dependent strategy.
As the machine-learning algorithm of RTrack always chooses a strategy for a Trial, even if the algorithm is not quite sure, there are a lot of strategy calls, that the algorithm does not have a high confidence in. It therefore is of interest to only choose and only work with data, where a certain confidence threshold is given.
We have observed during testing that confidence scores above 0.4 are typically accurate and reproducible
RTrack - Documentation
Following the recomendation of the RTrack documentation, a confidence threshold of 0.4 was choosen, which means that all strategies that did not were called with a confidence of 0.4 or higher, were discarded.
 fixed y axis scale tbd
 fixed y axis scale tbd
 fixed y axis scale tbd