CohortFlow
In this tutorial, we gonna explore briefly how to use SCALPEL-Analysis produce a detailed Flowchart. The Flowchart is the corner stone of the epidemiology studies, as it allows to asses the introduced biases through the cohort selection process.
The tutorial assumes that you have been given a valid Metadata JSON file, a file which is a result of SCALPEL-Extraction.
%matplotlib inline
%load_ext autoreload
%autoreload 2
%config InlineBackend.figure_format = 'retina'

import pandas as pd
pd.set_option('display.max_rows', 500)SCALPEL-Analysis is not yet available through PIP or Conda channels to be installed. However, as is the case for any Python library, it is pretty straight forward to add and use.
Before, proceeding you will need to download SCALPEL-Analysis as a zip from here. Put the zip wherever you judge suitable for you. Please make sure that you meet all the requirements explicited here.
I have downloaded the zip file, and put it under the path /home/sebiat/builds/cnam-model-001-interactions/dist/scalpel.zip.
There is two ways of doing it:
- Permanently add a directory to PYTHONPATH environmment variable. This will allow you to add it once and for all.
- Add it through
sysimport as shown below.
import sys
project_path = '/home/sebiat/builds/cnam-model-001-interactions/dist/scalpel.zip'
sys.path.append(project_path)As stated in the first comment cell, you will need to import the Metadata JSON. There is a straightforward way of doing it that will save the pain of a lot of boiler plate code. The following cell shows how.
from scalpel.core.cohort_collection import CohortCollection
import pytz

AGE_REFERENCE_DATE = pytz.datetime.datetime(2015, 1, 1, tzinfo=pytz.UTC)

cc = CohortCollection.from_json("metadata_fall_2020_01_27_16_46_39.json")
cc.add_subjects_information('omit_all', reference_date=AGE_REFERENCE_DATE)
cc.cohorts_names
2020-03-04 13:12:38 WARNING : Some patients and their events might be ommited
2020-03-04 13:12:39 WARNING : Some patients and their events might be ommited
2020-03-04 13:12:39 WARNING : Some patients and their events might be ommited
2020-03-04 13:12:39 WARNING : Some patients and their events might be ommited
2020-03-04 13:12:39 WARNING : Some patients and their events might be ommited
2020-03-04 13:12:39 WARNING : Some patients and their events might be ommited
2020-03-04 13:12:39 WARNING : Some patients and their events might be ommited
2020-03-04 13:12:39 WARNING : Some patients and their events might be ommited
2020-03-04 13:12:39 WARNING : Some patients and their events might be ommited
2020-03-04 13:12:39 WARNING : Some patients and their events might be ommited
2020-03-04 13:12:39 WARNING : Some patients and their events might be ommited
2020-03-04 13:12:39 WARNING : Some patients and their events might be ommited
2020-03-04 13:12:39 WARNING : Some patients and their events might be ommited
2020-03-04 13:12:39 WARNING : Some patients and their events might be ommited
2020-03-04 13:12:39 WARNING : Some patients and their events might be ommited
2020-03-04 13:12:39 WARNING : Some patients and their events might be ommited
2020-03-04 13:12:39 WARNING : Some patients and their events might be ommited
{'Cardiac',
'HTA',
'IPP',
'Opioids',
'acts',
'control_drugs_exposures',
'control_drugs_purchases',
'diagnoses',
'drug_purchases',
'epileptics',
'exposures',
'extract_patients',
'filter_patients',
'follow_up',
'fractures',
'interactions',
'liberal_acts',
'prescriptions',
'prescriptions_exposures'}
Right, we officially have a CohortCollection with a number of of Cohorts. But wait, what it is a CohortCollection? No rush, here is the definition from the SCALPEL paper, section 2.5:
The
CohortCollectionabstraction is a collection ofCohorts on which operations can be jointly performed. TheCohortCollectionhas metadata that keeps information about eachCohort, such as the successive operations performed on it, the Parquet files they are stored in and a git commit hash of the code producing the extraction from theSource.
CohortCollection can be seen in the same way a list or dict in Python is seen. It is a bag full of Cohorts that allows to iterate over, but also allows to apply operations to all the Cohorts at once. Finally, it allows to do specific operations for the CohortCollection such as finding the basic subjects Cohort which is the largest Cohort in the CohortCollection. We have a dedicated tutorial for CohortCollection.
What is usely called a Flowchart in epidemiology, is referenced in our library as CohortFlow. This naming is partly explained by the behaviour of the abstraction. It can be seen as an initial Cohort flowing through the steps of the chart.
Here is the definition as is in the SCALPEL3 paper:
The
CohortFlowabstraction is an orderedCohortCollection, where eachCohortis included in the previous one. It is meant to track the stages leading to a finalCohort, where each intermediateCohortis stored along with textual information about the filtering rules used to go from each stage to the next one.
Remember that each Cohort stores a description in human-readable format.
Technically, a CohortFlow is just an ordered collection of Cohorts. A user just pass a simple list of Cohort to initiate a CohortFlow object. The CohortFlow object than stores in two Python properties all the needed information:
-
ordered_cohorts: just a copy of the initial passed list. -
steps: are the realCohortsthat appear in epidemiological studies. Eachstep[n]being theCohortintersection betweenordered_cohorts[n]andstep[n-1].
# Import the necessary Python objects

from scalpel.core.cohort_flow import CohortFlow

# create the CohortFlow

cf = CohortFlow([
    cc.get('extract_patients'),
    cc.get('exposures'),
    cc.get('filter_patients'),
    cc.get('fractures')
])
The above cohort flow can be translated to the following human readable steps:
- Get all the subjects available.
- Keep only exposed subjects.
- Keep only filtered subjects. In this particular case, subjects not exposed in the first year of the study.
- Keep only fractured subjects.
# Explore the ordered_cohorts
for cohort in cf.ordered_cohorts:
    print(cohort.describe())
This a subject cohort, no event needed. Subjects are from operation extract_patients.
Events are exposures. Events contain only subjects with event exposures.
This a subject cohort, no event needed. Subjects are from operation filter_patients.
Events are fractures. Events contain only subjects with event fractures.
The most basic idea of the flow chart is to flow the evolution of the cohort through the construction. How can for instance record the number of subjects? the following shows how?
for (i, cohort) in enumerate(cf.steps):
    print('Number of subjects in step {} of the CohortFlow is {}'.format(i, cohort.subjects.count()))
Number of subjects in step 0 of the CohortFlow is 5136102
Number of subjects in step 1 of the CohortFlow is 2657119
Number of subjects in step 2 of the CohortFlow is 1877490
Number of subjects in step 3 of the CohortFlow is 66448
The stats module and the CohortFlow are the perfect combination. Together, they leverage the user to get insights in the studied data and spot eventual biases. One major advantage is that all the stats that exist can be easily used on all the steps of the cohort flow. Look at the example below.
from scalpel.stats.patients import registry
import matplotlib.pyplot as plt
for plot in registry:
for cohort in cf.steps:
figure = plt.figure(figsize=(8, 4.5))
plot(cohort=cohort, figure=figure)

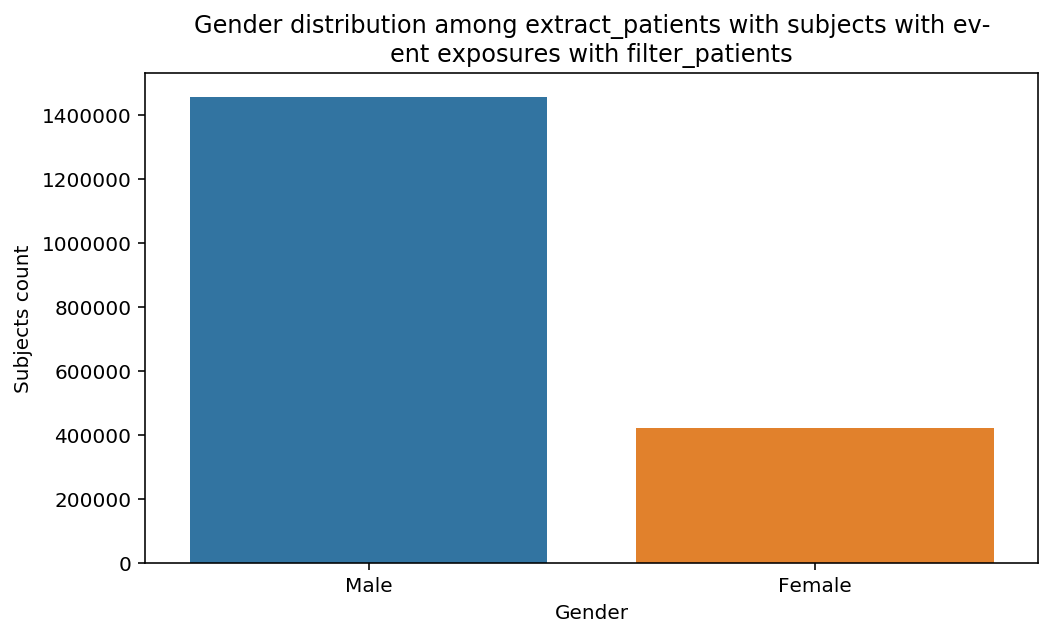


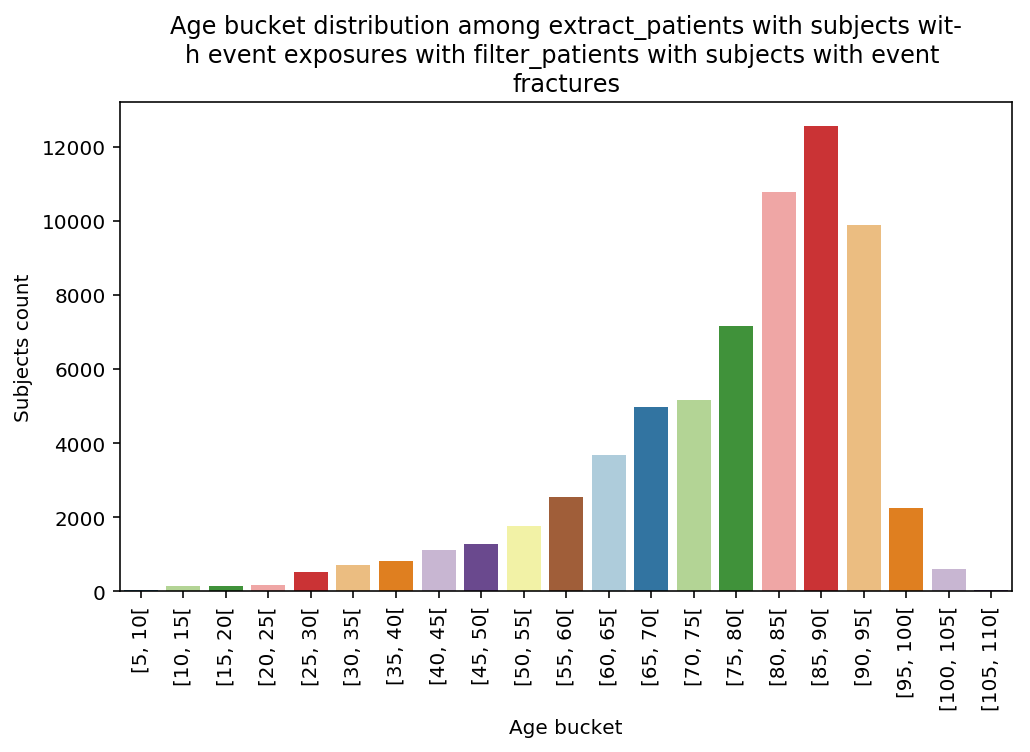


The graphs show a bias toward the elderly especially in the last step. The limitation to the fractured induced a sharp bias toward 80+.
An important remark: at each step, the title of the graph changes automatically to reflect the underlyning used cohort. This is very important as it allows to share the results without too much explanations.
Suppose you want a stats about the distrubution of fractures in each step of the CohortFlow. Since the current steps are Subjects Cohorts it cannot be done directly. CohortFlow offers a handy way of doing it.
from scalpel.stats.event_distribution import plot_events_per_month_as_barsfor cohort in cf.prepend_cohort(cc.get('fractures')).steps:
figure = plt.figure(figsize=(8, 4.5))
plot_events_per_month_as_bars(cohort=cohort, figure=figure)

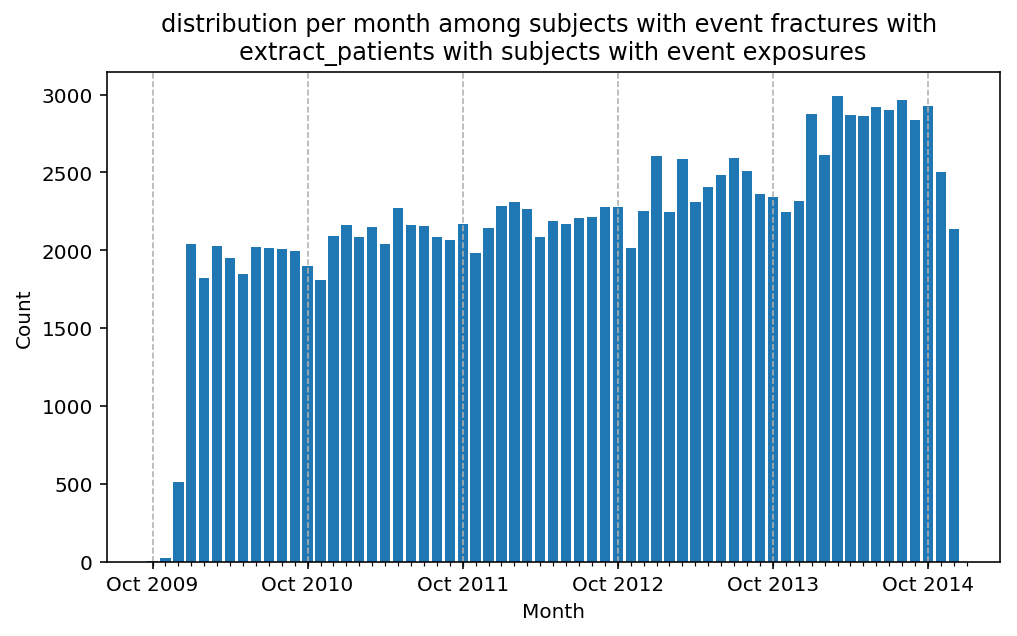


We can spot that the third step of the CohortFlow introduces a bias. The third step filters out subject exposed in the first year, which is reflected in the drop of the number of fractures in the first year of the study. One can conclude from this remark, that there is a correlation between being exposed and fractured which is exactly the subject of this study!