The objective of the study was to gather, clean and analyse over 5000+ tweets from a twitter account @dog_rates (WeRateDogs), draw some insights and make a visualization to communicate one of the insights drawn. WeRateDogs is a Twitter account that rates people's dogs with a humorous comment about the dog. The account was started in 2015 by college student Matt Nelson, and has received international media attention both for its popularity and notoreity. As always, the entire data wrangling process contains three major steps, namely:
- Data gathering
- Data assessing
- Data cleaning
Although, we did go beyond by both analysing the data and visualizing it with a plot. This was necessary as the data wrangling process isn't a stand alone process and for complete analysis, it must be combined with other processess to arrive at conclusions. I would be explaining in brief details the step-by-step prodecure that was undergone in this wrangling process
In this phase, three datasets were indicated to be necesary for the analysis.
One was provided beforehand (twitter_archive_enhanced.csv), and all that was needed to be done was to read it in as a CSV file into a dataframe using the pandas' read_csv function. The second file (image-predictions.tsv), was to be downloaded programmtically using the 'requests' library and then stored into a file on the pc before being read into a dataframe using the read_csv function again. This time though, it was required to specify the delimiter as an argument because tsv files are separated using tabs instead of commas like in a csv file. The third file was the most difficult to gather, partly because the concept was quite new to me and also because it required requesting access to Twitter's API. Unfortunately I wasn't granted access on time to the API so I opted to use the alternative that was provided by Udacity. This alternative involved downloading an already provided text file (tweet-json.text), and then reading the file line by line into a pandas dataframe. This brought me to the end of the gathering process with the three files successfully read into three different dataframes.
For this phase, I had to look at the three datasets both visually and programmatically to be able to notice and assess any possible quality or tidiness issue in the datasets before cleaning them in the next phase. A couple of issues were noted and documented in preparation for the cleaning phase. As with most data set, there were two majoy types of issues with the dataset, tidiniess and quality issues. The documented assessment is given below.
- Quality issues
The rating numerator column was extracted and populated wrongly, as some ratings with decimals were not extracted correctly
The 'retweeted_status_id' column shows that there are 180 non-null rows, while the specification states that we only want original ratings with no retweets
The timestamp column and the create_date column are the same. To avoid repititon we are going to drop the create_date column in the thrid dataframe.
Drop unwanted columns that aren't necessary for analysis.
The 'tweet_id' column is an integer instead of a string.
The 'timestamp' column data type is an object instead of a datetime data type
The favourite and retweet count shouldn't be a float
The 'img_num' column has 4 as it's maximum value while only 3 predictions were given in the data
Some of the dog names in the 'p1', 'p2' and 'p3' columns aren't consistent as some start with upper case while the other are all in lowercase.
The 'source' column is overpopulated with irrelevant information, making it difficult for us to tell the source. More than one variable is contained in one column where we need only the source without the link.
- Tidiness issues
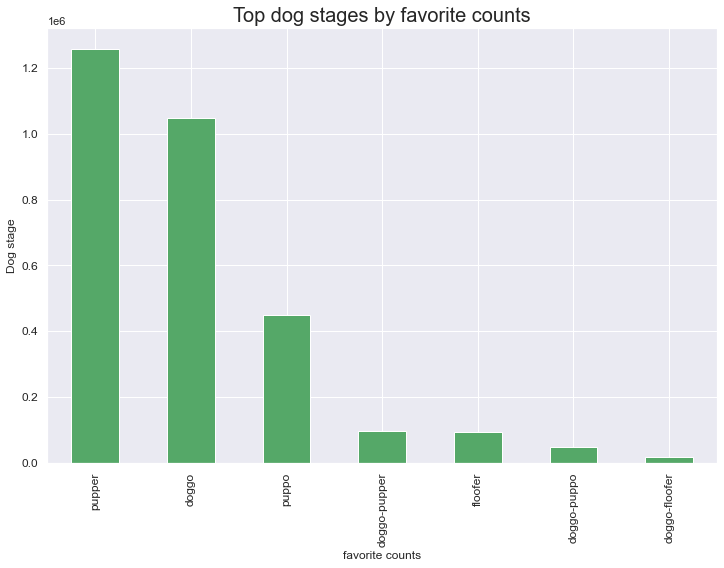
The 'doggo', 'floofer', 'pupper' and 'puppo' columns should all be values instead of variables. The observations are recorded as variables instead of values.
The three datasets should be merged into one dataset as all the three datasets are part of the same observational unit.
After documenting the issues that were noted, I proceeded to cleaning the datasets in the next phase.
Data cleaning basically involves tackling the quality and tidiness issues that were note in the previous phase - Data assessing. With the use of formulas, functions and loops, most of the issues were cleaned. As was required by Udacity, the entire datasets were not to be cleaned in it's entirety. Rather, a minimum of 8 quality issues and 2 tidiness issues were to be worked on.
During the cleaning the datasets, I combined the three into one master dataset (twitter_archive_master.csv) and saved it in preparation for analysis and visualization.
For insights on analysis and visualization, please refer to the 'act_report.html' file which contains a brief summary of the insights gotten from analysis.
Jupyter Notebook, HTML, Twitter API
Python, HTML, Pandas, Matplotlib, Seaborn,Tweepy
👀 I’m interested in Python programming
🌱 I’m currently learning Machine Learning and Data Science using python
💞️ I’m looking to collaborate on any development project
📫 How to reach me: richieans12@gmail.com