Colour Trend Analysis using Machine Learning and Histogram
So far, this report has considered models that depend upon training data in the form of features. It is time to show how a Histogram can help to depict colour trends in an advanced way. Based on the concept of clustering methods, data can be put as each point in a group. In different words, data can be categorized as a set of entities, based on their properties, automatically (Unsupervised Learning).
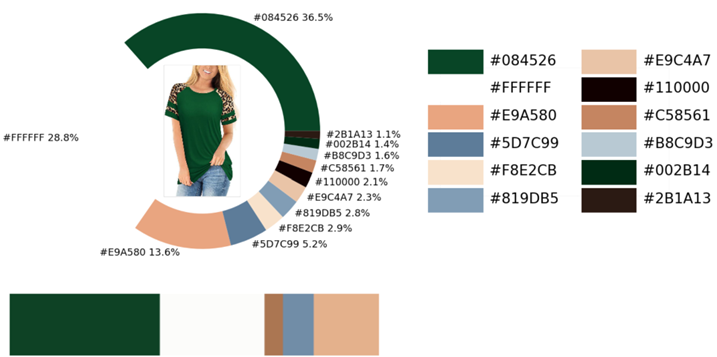
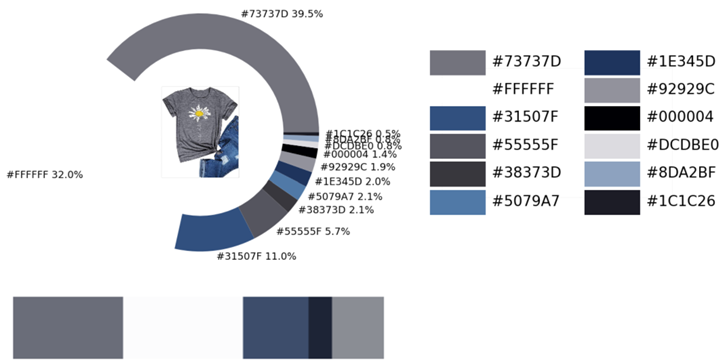
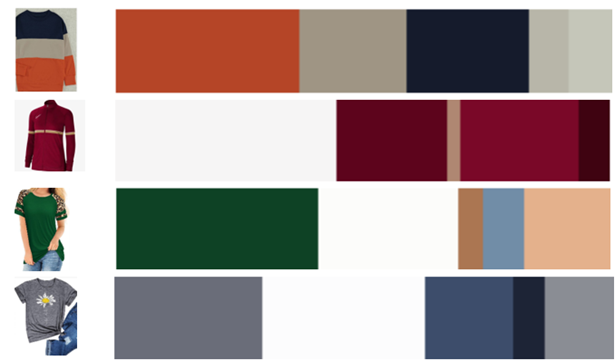
One viewpoint of detecting colour, and analysing it is about using AI to explore the colour data in digital photos of ready-to-wear luxury brands from websites to generate insights about colour trends. In this report, AI is used to analyse and depict the colours based on images as a sample as shown in figure
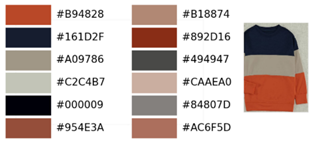
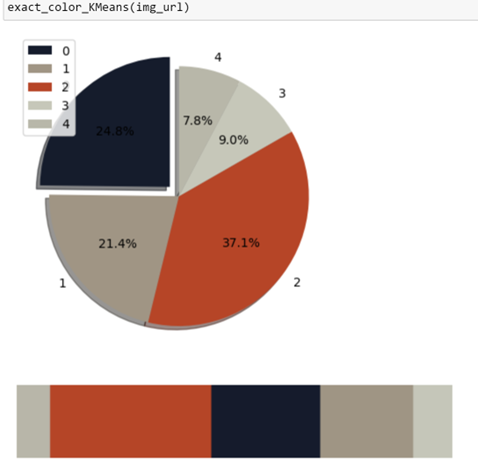
First, explain each node in V to show the enumeration colour group and their proportions in the form (colour) for each colour that is displayed on the object to construct a histogram of the object colour data. For simplicity, Hear Nodes contain only colour information, but they are capable of describing ratio, texture, and other features. The geo-location of the gathered colours was then displayed on the graph's edges[11]. The V and E as two matrices can be preserved in the straightforward below constructed to draw a graph, as they are shown in figure 8[11], to make the display and maintenance of the extracted colour information simple. V displays the colour code weights, while E describes how the colours in an image relate to one another. As a result, as is depicted in the right part of figure 10, each colour of the image could be shown based on their frequency and their relationship.