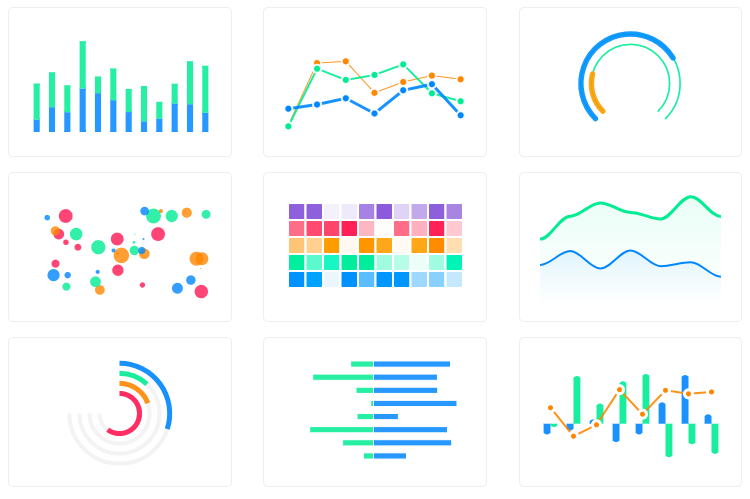
Stencil.js wrapper for ApexCharts to build interactive visualizations in modern web applications.
Major Updates:
- 🚀 Stencil v4 support (requires Stencil 4.x)
- 📊 ApexCharts v4+ support (requires ApexCharts >=4.0.0)
- 🔧 TypeScript 5.6 with modern ES2022 target
- 🎯 New component methods:
updateSeries(),refresh() - 📱 Better responsive behavior with ResizeObserver
- ⚡ Performance improvements and memory leak fixes
Migration Required: This is a breaking release. See Migration Guide below.
# Install both packages
npm install stencil-apexcharts apexcharts

# Peer dependencies
npm install apexcharts@^4.0.0<!-- ApexCharts core library -->
<script src="https://cdn.jsdelivr.net/npm/[email protected]/dist/apexcharts.min.js"></script>
<!-- Stencil ApexCharts component -->
<script
type="module"
src="https://unpkg.com/stencil-apexcharts@3/dist/apex/apex.esm.js"
></script>
<script
nomodule
src="https://unpkg.com/stencil-apexcharts@3/dist/apex.js"
></script>import { defineCustomElements } from "stencil-apexcharts/loader";
defineCustomElements(window);import { defineCustomElements } from "stencil-apexcharts/loader";
defineCustomElements(window);
// In your component
<apex-chart
type="bar"
series={[{ name: "sales", data: [30, 40, 35] }]}
options={{ xaxis: { categories: ["A", "B", "C"] } }}
/>;// main.ts
import { defineCustomElements } from 'stencil-apexcharts/loader';
defineCustomElements(window);
// In component
<template>
<apex-chart
type="line"
:series="series"
:options="options"
/>
</template><apex-chart id="myChart"></apex-chart>
<script>
const chart = document.querySelector("#myChart");
chart.type = "bar";
chart.width = "100%";
chart.height = 350;
chart.series = [
{
name: "Revenue",
data: [30, 40, 35, 50, 49, 60, 70, 91, 125],
},
];
chart.options = {
xaxis: {
categories: [2015, 2016, 2017, 2018, 2019, 2020, 2021, 2022, 2023],
},
title: {
text: "Annual Revenue",
},
};
</script><apex-chart id="advancedChart"></apex-chart>
<script>
const chart = document.querySelector("#advancedChart");
chart.type = "line";
chart.height = 400;
// Enable toolbar with all tools
chart.toolbar = {
show: true,
tools: {
download: true,
selection: true,
zoom: true,
zoomin: true,
zoomout: true,
pan: true,
reset: true,
},
};
chart.series = [
{
name: "Users",
data: [28, 29, 33, 36, 32, 32, 33, 39, 41, 45],
},
{
name: "Sessions",
data: [12, 11, 14, 18, 17, 13, 13, 16, 19, 22],
},
];
chart.options = {
stroke: { curve: "smooth" },
xaxis: {
categories: [
"Jan",
"Feb",
"Mar",
"Apr",
"May",
"Jun",
"Jul",
"Aug",
"Sep",
"Oct",
],
},
};
</script><apex-chart id="stackedChart"></apex-chart>
<script>
const chart = document.querySelector("#stackedChart");
chart.type = "bar";
chart.stacked = true;
chart.stackType = "100%"; // or 'normal'
chart.series = [
{ name: "Product A", data: [44, 55, 41, 67, 22] },
{ name: "Product B", data: [13, 23, 20, 8, 13] },
{ name: "Product C", data: [11, 17, 15, 15, 21] },
];
</script>| Property | Attribute | Type | Default | Description |
|---|---|---|---|---|
type |
type |
ChartType |
undefined |
Chart type (line, bar, pie, etc.) |
width |
width |
string | number |
undefined |
Chart width (e.g., '100%', 400) |
height |
height |
string | number |
undefined |
Chart height (e.g., '300px', 350) |
series |
-- | ApexOptions['series'] |
undefined |
Chart data series |
options |
-- | ApexOptions |
undefined |
ApexCharts configuration object |
toolbar |
-- | ChartToolbar |
undefined |
Toolbar configuration |
stacked |
stacked |
boolean |
undefined |
Enable stacked charts |
stackType |
stack-type |
'100%' | 'normal' |
undefined |
Stack type for stacked charts |
All methods return Promise<void> and can be called programmatically:
// Update chart configuration
await chart.updateOptions(newOptions, redrawPaths?, animate?);

// Update chart series data
await chart.updateSeries(newSeries, animate?);

// Completely refresh/recreate the chart
await chart.refresh();Charts automatically update when properties change:
// This will automatically update the chart
chart.series = newData;
chart.options = newOptions;

// Or update programmatically
chart.updateSeries([{ name: "New Data", data: [1, 2, 3] }]);-
Peer Dependencies Updated
# Old
npm install apexcharts@^3.26.1

# New
npm install apexcharts@^4.0.0
-
Stencil v4 Required
npm install @stencil/core@^4.22.0
-
New Component Methods
// New methods available
await chart.updateSeries(newSeries);
await chart.refresh();
-
Improved TypeScript Support
- Stricter type checking
- Better IntelliSense support
- ES2022 target
-
Update dependencies:
npm install stencil-apexcharts@^3.0.0 apexcharts@^4.0.0
-
Check ApexCharts v4 breaking changes: Review the ApexCharts v4 migration guide
-
Update TypeScript config (if using TypeScript):
{ "compilerOptions": { "target": "es2022", "lib": ["dom", "dom.iterable", "es2022"] } } -
Test your charts to ensure they render correctly with ApexCharts v4
git clone https://github.com/apexcharts/stencil-apexcharts.git
cd stencil-apexcharts
npm installnpm run startStarts development server at http://localhost:3333 with hot reloading.
npm run buildnpm run test- Node.js: 16+
- Stencil: 4.x
- ApexCharts: 4.x
- TypeScript: 5.x (if using TypeScript)
- Chrome 88+
- Firefox 78+
- Safari 14+
- Edge 88+
Modern browsers with ES2022 support.
We welcome contributions! Please see our Contributing Guidelines.
MIT License. See LICENSE file for details.


