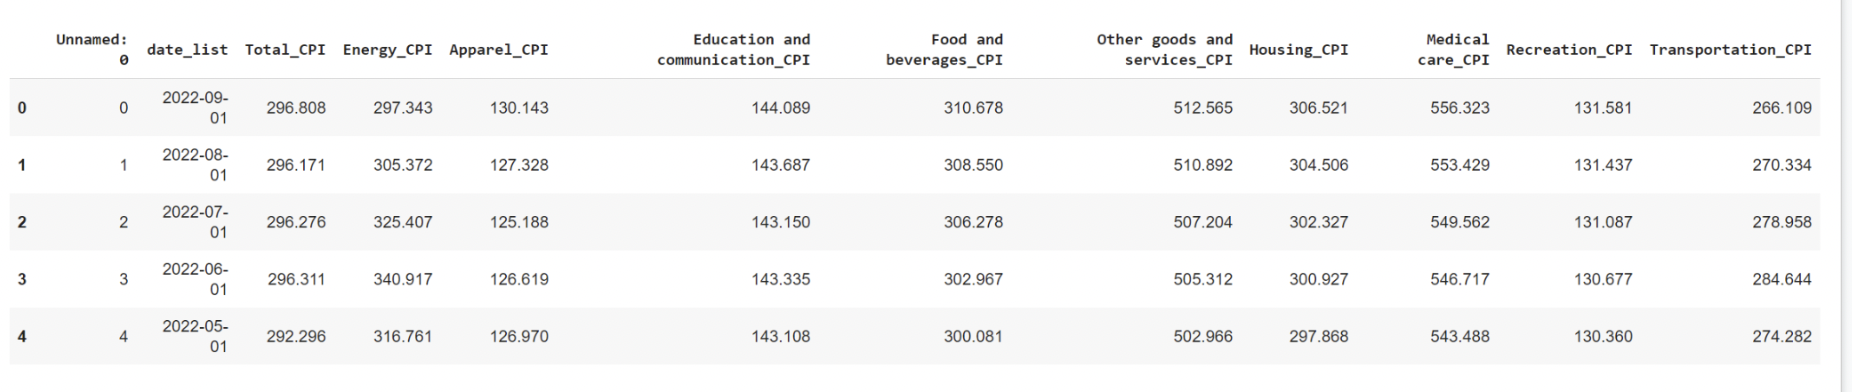
Through an API call to the U.S. government website, we pulled data and cleaned it using Pandas. Through SkLearn linear regression models, we proved that inflation in the past few years is exceptionally high, with major increases in CPI. Medical Care has the highest CPI increase, followed by Food/ beverages and Housing, then Total CPI. We disregard Energy CPI as it has a R2 value of 0.3 which means it does not really follow a linear regression, the coefficient found is not accurate.
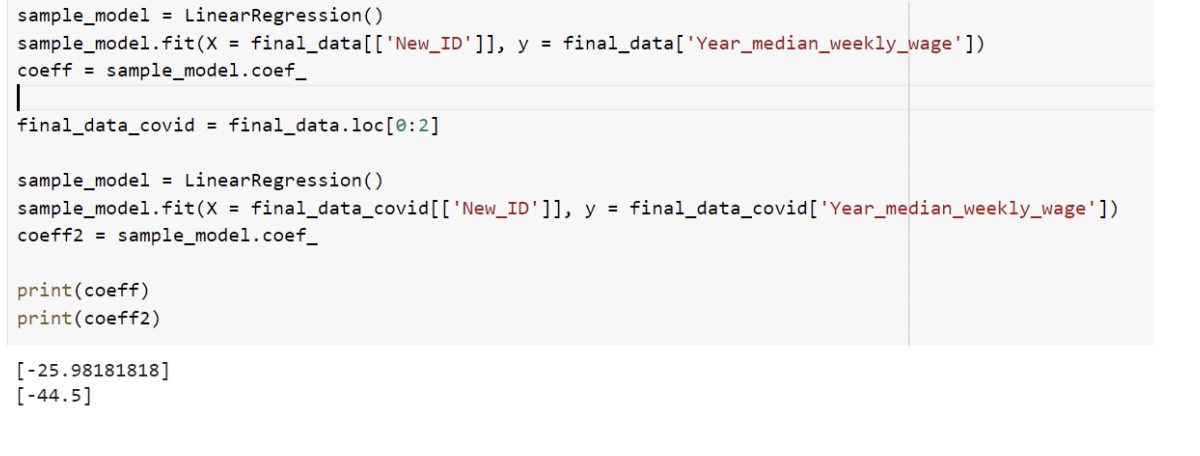
We also visualized the unemployment rates amongst different races using SeaBorne. We discovered that Native Americans had the highest unemployment rate of 30%. We discovered that weekly wages increased at a higher rate during COVID, which was surprising. Weeekly wages increased by $45 in COVID versus $25.98 in NON-COVID times.