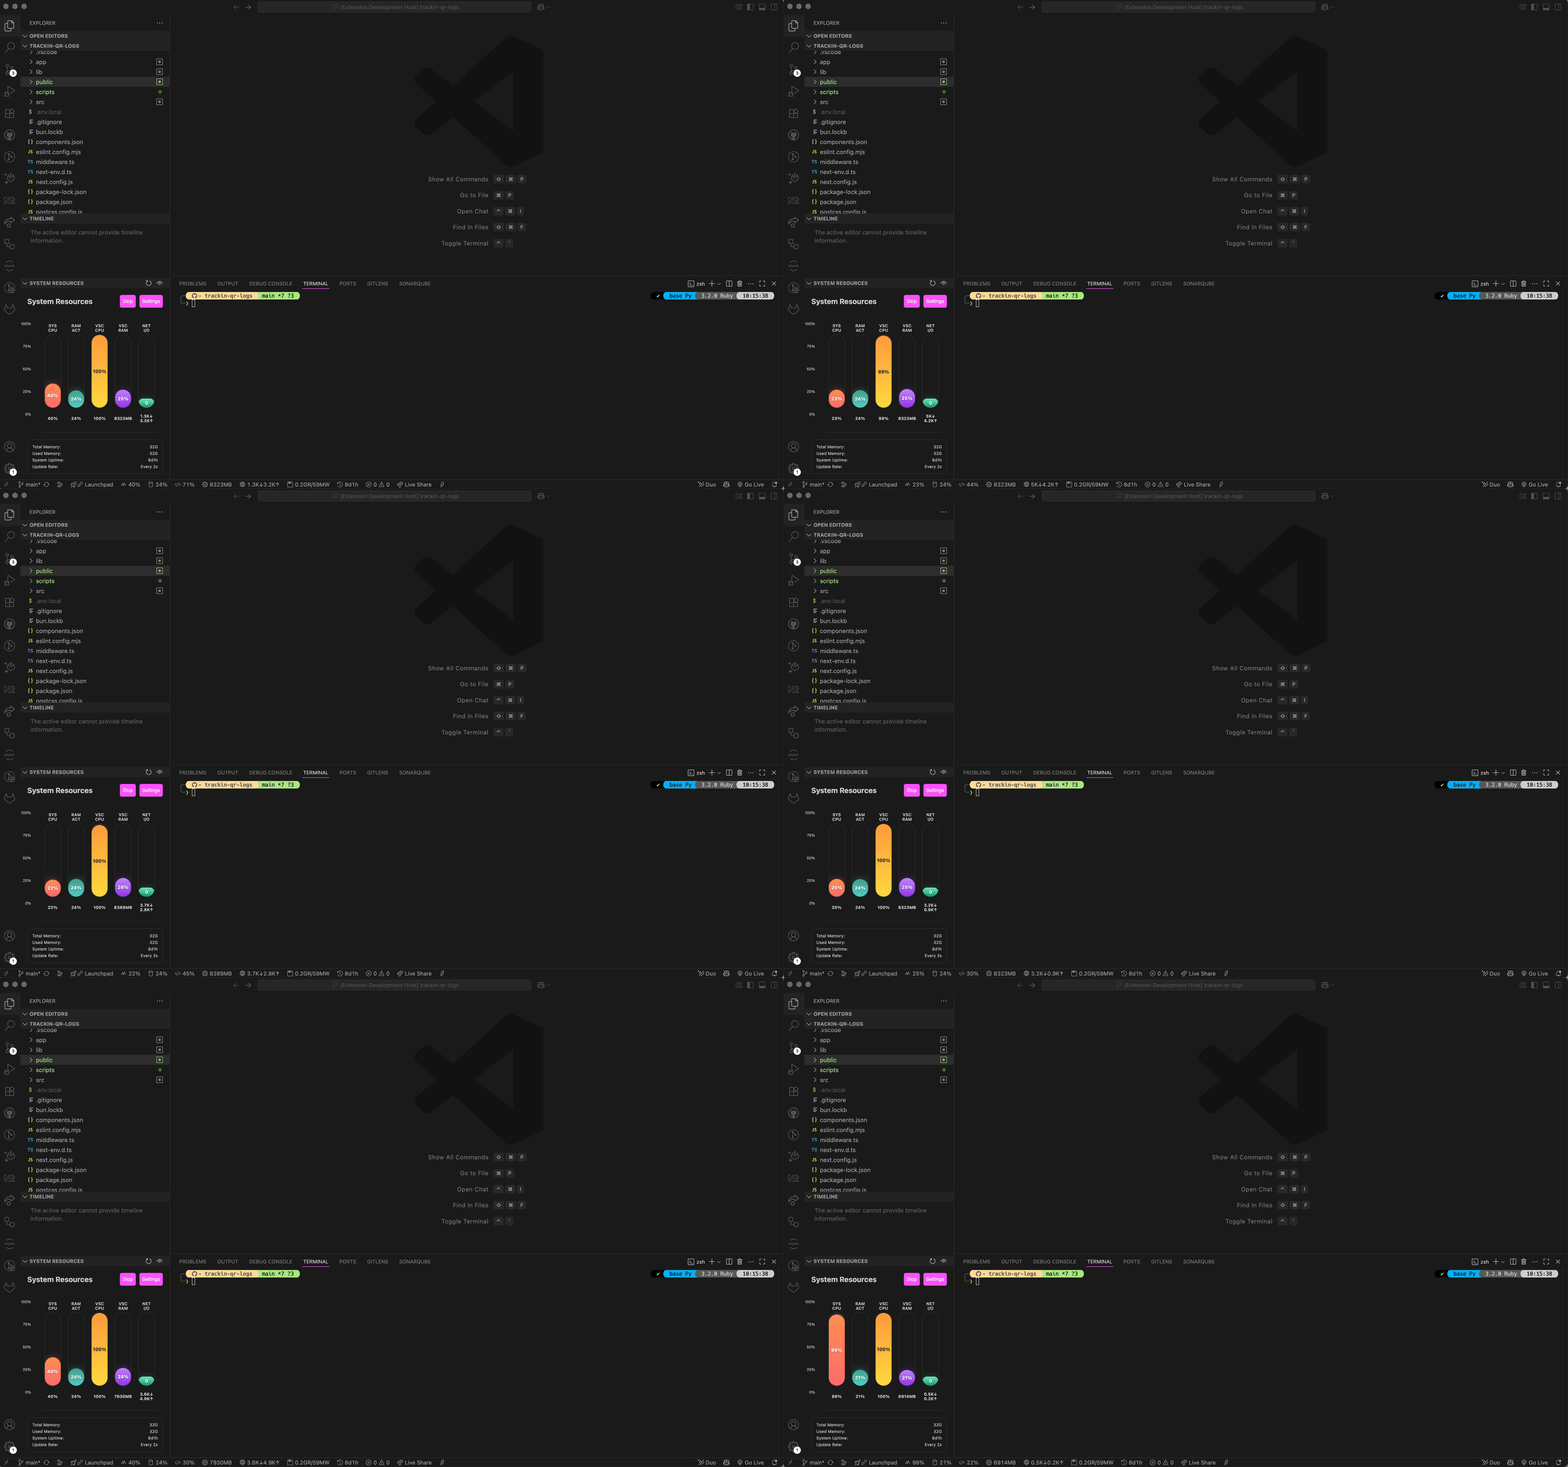
📊 Real-time system performance monitoring with animated CPU, memory, and resource usage graphs in VS Code
⚡ Essential for developers who want to monitor system resources without leaving VS Code ⚡
This extension is your system performance dashboard right inside VS Code. It provides real-time monitoring of CPU, memory, and system resources with beautiful animated graphs, ensuring you stay aware of your system's health while coding.
- ✨ Why You'll Love This Extension
- 🚀 Quick Start
- 📋 Features & Metrics
- ⚙️ Configuration
- 🛠️ Development & Contributing
- 💝 Support
- 📄 License
Keep track of your system's health without leaving VS Code:
- CPU Usage - Real-time CPU utilization monitoring
- Memory Usage - System and VS Code memory consumption
- VS Code Performance - Specific VS Code CPU and memory usage
- Network I/O - Network activity monitoring
Just install and go! Works seamlessly with:
- Any Operating System - Windows, macOS, and Linux support
- All VS Code Workspaces - Automatic activation on startup
- Lightweight Monitoring - Minimal performance impact
- Customizable Updates - Adjustable refresh intervals
- Status Bar Integration - Quick glance at system metrics
- Visual Graphs - Beautiful animated charts in the sidebar
- Configurable Display - Show/hide specific metrics
- Performance Optimized - Efficient resource usage
Designed for modern development workflows:
- 📊 Animated Charts - Real-time visual feedback
- 🎯 Clean Design - Integrates seamlessly with VS Code
- 📱 Responsive Layout - Works in any sidebar size
- 🎨 Color-coded Metrics - Easy to read at a glance
📦 Installation (Click to expand)
- Open VS Code
- Press
Ctrl+Shift+X(orCmd+Shift+Xon macOS) - Search for "System Performance"
- Click Install ✨
code --install-extension bubablue00.system-performanceDownload the latest .vsix file from releases and install manually.
- Install the extension from the VS Code Marketplace
- Open any workspace in VS Code
- View system metrics in the status bar at the bottom
- Open the System Resources panel in the Explorer sidebar for detailed graphs
- Configure settings via VS Code preferences to customize what metrics to show
Pro Tip: Click on any status bar item to quickly open the detailed system resources panel!
| Metric | Status Bar | Graph View | Configurable |
|---|---|---|---|
| System CPU | ✅ | ✅ | ✅ |
| System Memory | ✅ | ✅ | ✅ |
| VS Code CPU | ✅ | ✅ | ✅ |
| VS Code Memory | ✅ | ✅ | ✅ |
| Network I/O | ✅ | ✅ | ✅ |
- System CPU Usage - Overall system CPU utilization percentage
- System Memory - Total system memory usage with available/used breakdown
- VS Code CPU - CPU usage specifically by the VS Code process
- VS Code Memory - Memory consumption by VS Code and its extensions
- Network Activity - Upload/download network I/O statistics
System Performance: Show System Graph- Open the system resources panelSystem Performance: Toggle System Graph- Toggle the panel visibilitySystem Performance: Refresh- Manually refresh all metricsSystem Performance: Toggle Monitoring- Enable/disable real-time monitoring
Customize the extension behavior through VS Code settings:
{
  "systemGraph.showCpu": true,              // Show CPU usage bar
  "systemGraph.showMemory": true,           // Show memory usage bar
  "systemGraph.showVscodeCpu": true,        // Show VS Code CPU usage bar
  "systemGraph.showVscodeMemory": true,     // Show VS Code memory usage bar
  "systemGraph.showNetwork": true,          // Show network I/O bar
  "systemGraph.statusBarEnabled": true,     // Enable/disable status bar monitoring
  "systemGraph.updateInterval": 2000        // Update interval in milliseconds (500-10000)
}- Individual Metrics Control - Toggle specific metrics on/off
- Status Bar Display - Enable/disable status bar integration
- Update Frequency - Customize refresh interval (0.5-10 seconds)
- Visual Customization - Control which graphs and bars are displayed
🚀 Local Development Setup
Node.js 16+, npm and VS Code 1.60+
# Clone the repository
git clone https://github.com/bubablue/system-performance-extension.git
cd system-performance-extension

# Install dependencies
npm install

# Open in VS Code
code .

# Start development
npm run watch# Run all tests
npm test
- Press
F5to launch the Extension Development Host - Open a test project in the new window
- Test the extension functionality
npm run package🤝 How to Contribute
We welcome contributions! Here's how you can help:
- 🐛 Report Bugs - Found an issue? Open an issue
- 💡 Suggest Features - Have an idea? We'd love to hear it!
- 📝 Improve Documentation - Help make the docs even better
- 🔧 Submit Code - Fix bugs or add features with a PR
- Fork the repository
- Create a feature branch (
git checkout -b feature/amazing-feature) - Commit your changes (
git commit -m 'Add amazing feature') - Push to the branch (
git push origin feature/amazing-feature) - Open a Pull Request
|
|
💡 Have an idea? Suggest a feature • 🐛 Found a bug? Report it
This project is licensed under the MIT License - see the LICENSE file for details.
Made with ❤️ by developers, for developers
Monitor your system resources without leaving your favorite editor


