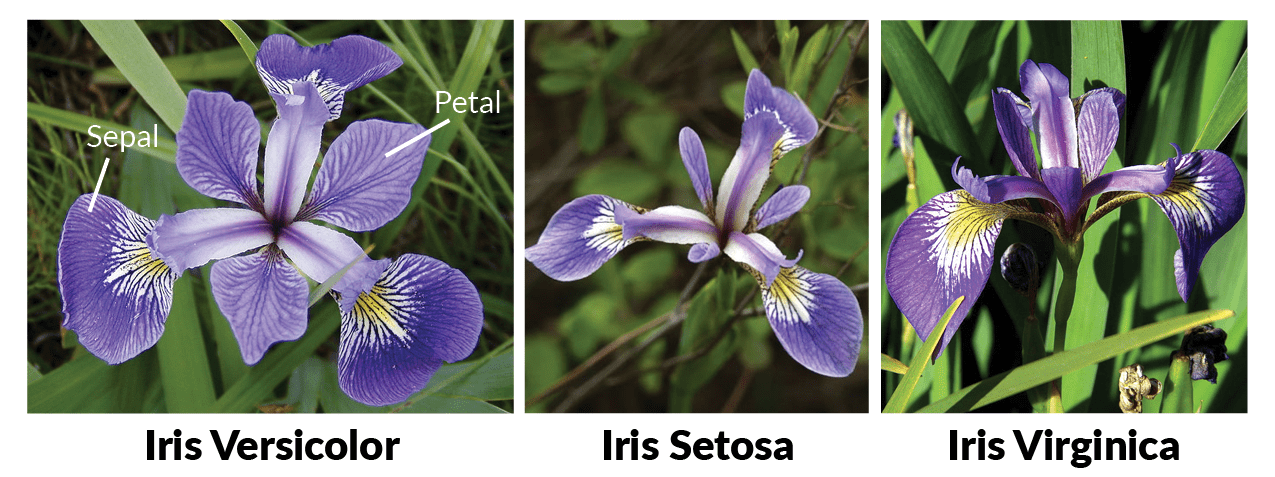
The iris dataset dates back almost a century to 1934, having been collected by Edgar Anderson – an American botanist and geneticist. Anderson was attempting to determine the possibility of one species of iris evolving from another. From the Gaspé Pensinsula in Canada, he collected 50 samples from two species of iris, the Setosa and the Versicolor. From each sample collected, Anderson measured the petal width and length and also the sepal width and length. He hoped to investigate if the similarities could show one evolved from the other. It should be noted that the current iris dataset contains a third species of iris, the Virginica which differs from the other two samples and was taken from a different colony. It is not clear if indeed Anderson collected this third sample.
https://s3.amazonaws.com/assets.datacamp.com/blog_assets/Machine+Learning+R/iris-machinelearning.png
Around the time Anderson collected his samples, Sir Ronald Aylmer Fisher, a famous mathematician and statistician, was investigating linear discrimination analysis (LDA), that is, a method of finding a linear combination of features that characterises two or more classes of objects or events. The resulting combination may be used as a linear classifier, or, more commonly, for dimensionality reduction before later classification. Anderson’s dataset had characteristics that made it suitable for data analytics and ws therefore was chosen by Fisher in his 1936 classic paper, The Use of Multiple Measurements in Taxonomic Problems.
The dataset includes three species of iris with 50 samples each, making it an ideal size of dataset with which to work. Each sample has five attributes recorded, four of them being measurements (in centimetres) of the width and length of the sepal, and the width and length of petal, while the fifth being its species or class of iris. Previous studies have found that one species is linearly separable from the other two, but the other two are not linearly separable from each other. Based on the combination of the four measurement features, Fisher developed a linear discriminant model to discriminate or distinguish the Iris species from each other. That is referred to as discriminant analysis, finding the best linear combination of independent variables that will discriminate between the categories of the dependent variables, and determine if significant differences exists among the groups of predictor variables. He showed that the differences between the Setosa and the Versicolor was substantially greater than the standard deviations of the compound measurements, while the difference between the Virginica and the Versicolor was less than four times the standard deviation of each species. Therefore, he concluded that unlike with Setosa, the distributions of the Virginica and the Versicolor are not as easily distinguished from one another based solely on the four measurements.
In my investigation of this iris dataset, I wanted to see which of the four features could be the most effective in distinguishing between three species/classes of iris. According to my statistical analysis, the petal length was the most effective in determining the species of iris, followed closely by the petal width.
This exploratory data analysis included visualising the iris dataset using scatter plots to identify the relationship between sepal lengths and widths, and the relationship between petal lengths and widths, using histograms of each feature to understand the distribution, and using box plots to compare their interquartile ranges and central tendencies. Finally, pair plots are used to visualize the pairwise relationships between all four features.