RFC: chaos engineering as a service #14
There are no files selected for viewing
This file contains hidden or bidirectional Unicode text that may be interpreted or compiled differently than what appears below. To review, open the file in an editor that reveals hidden Unicode characters.
Learn more about bidirectional Unicode characters
| Original file line number | Diff line number | Diff line change |
|---|---|---|
| @@ -0,0 +1,116 @@ | ||
| # Chaos Engineering as a Service (CAAS) | ||
|
|
||
| ## Summary | ||
|
|
||
| Build a unified dashboard to manage and monitor experiments for multiple | ||
| platforms and multiple clusters. | ||
|
|
||
| Related Issue: https://github.com/chaos-mesh/chaos-mesh/issues/1462 | ||
|
|
||
| ## Motivation | ||
|
|
||
| Following problem exists with the current chaos-mesh design: | ||
|
|
||
| 1. Cost of maintainance and change is high, since chaos-daemon and chaosd are | ||
| two seperate programs that serve similar purpose. | ||
| **Goal is to abstract out common parts of two into a common library.** | ||
| 2. Poor observability of experiment results from within the dashboard | ||
| **Goal is to collect the metrics by Prometheus and show in dashboard.** | ||
|
|
||
| ## Detailed design | ||
|
|
||
| ### Architecture redesign | ||
|
|
||
| Current architecture: https://chaos-mesh.org/docs/overview/architecture | ||
|
|
||
| 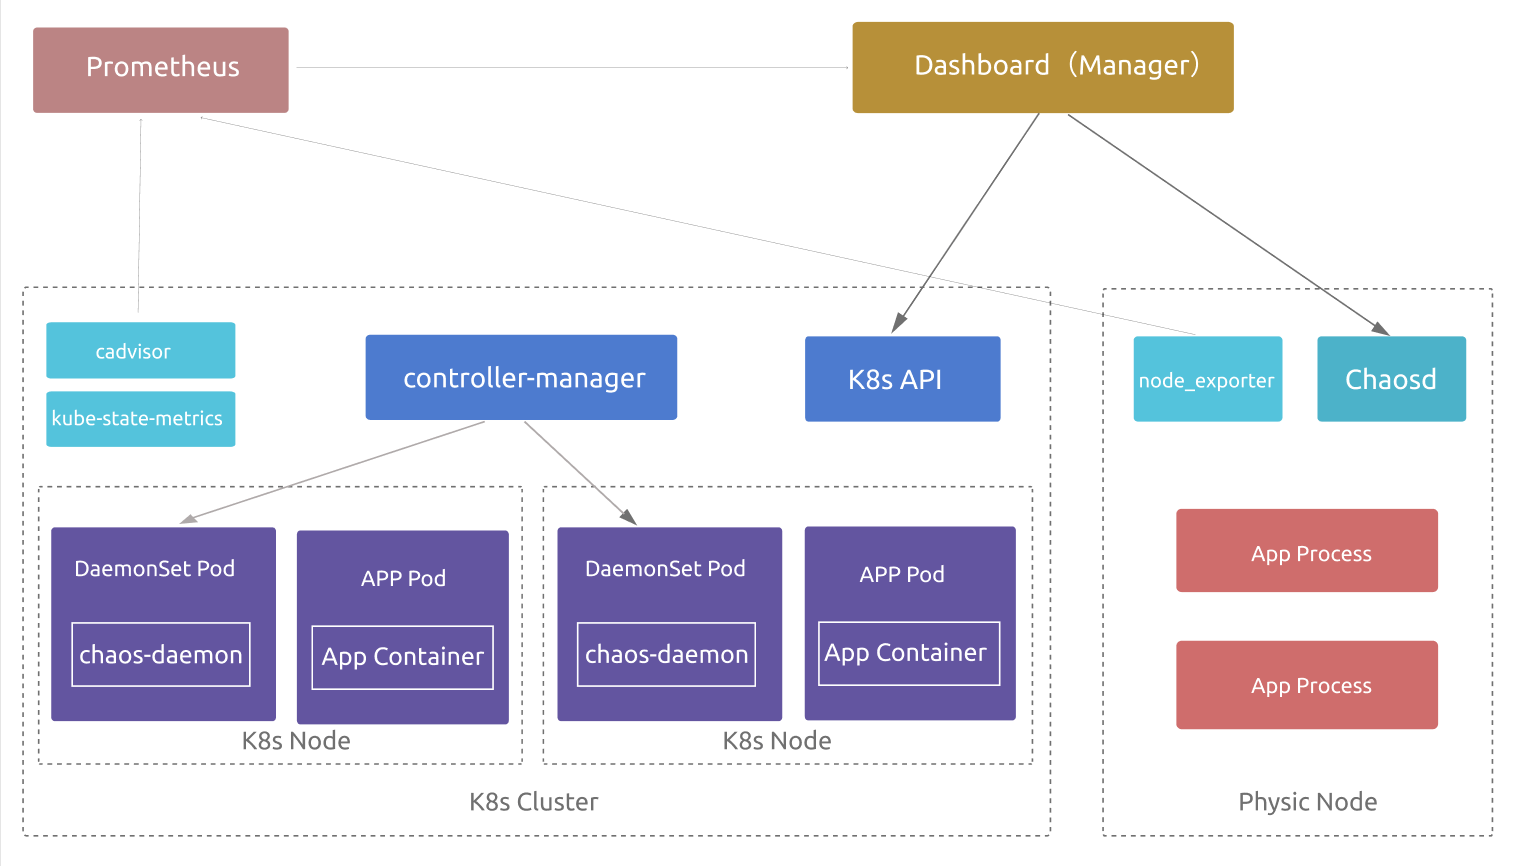 | ||
|
|
||
| So, unlike the current architecture, Chaos Dashboard is truly multi-cluster | ||
| since it can exist outside the cluster and manage multiple chaos controllers | ||
| and even chaosd for physic nodes. | ||
|
|
||
| There's an addition for Prometheus to collect node metrics to incorporate | ||
| better visibility of experiment results in the dashboard. | ||
|
|
||
| ### Unify chaosd and chaos-daemon | ||
|
|
||
| chaosd and chaos-daemon both serve similar purposes but targeted at different | ||
| types of nodes - physic nodes and kubernetes' worker nodes respectively. | ||
| And that's why their communication mechanism is totally different: | ||
|
|
||
| - chaosd lacks server support and so it's only a CLI for now | ||
| - chaos-daemon communicates with chaos controller via gRPC | ||
|
|
||
| So most of the logic (the ones causing chaos amongst other things) can be | ||
| abstracted down to a common library for both chaosd and chaos-daemon. | ||
| This ensures easy maintainance and easy-to-change for these components. | ||
|
|
||
| Server support needs to be added to chaosd so it listens for authenticated | ||
| requests on some port of the host machine. | ||
|
|
||
| ### Authentication & Authorization | ||
|
|
||
| #### Chaosd | ||
|
|
||
| Chaosd runs on physic nodes outside kubernetes cluster, so it is vulnerable to attack | ||
| from internet. To prevent misuse of chaosd, it needs to allow only authenticated | ||
| requests. The easiest and secure setup is to use SSL certificates to both encrypt | ||
| the request data and for authentication. | ||
|
Comment on lines
+55
to
+58
There was a problem hiding this comment. should unit them into one line There was a problem hiding this comment. have some problems below There was a problem hiding this comment. umm.. basically combine to one sentence?? |
||
|
|
||
| From the perspective of communication, the dashboard will represent the end user | ||
| and so act as a client, whereas chaosd instance would represent the server. | ||
| The client can be authenticated here by making use of | ||
| [SSL Client Authentication](https://aboutssl.org/ssl-tls-client-authentication-how-does-it-works/) | ||
| technique. | ||
|
|
||
| In this setup, private key of the certificate will be generated and kept with the | ||
| dashboard and public key would be stored on chaosd nodes. On any request, | ||
| chaosd would first verify the digital signatures presented by the client to | ||
| authenticate the request. | ||
|
Comment on lines
+66
to
+69
There was a problem hiding this comment. I have a question, the private key is kept by client(dashboard),is it looks strange? There was a problem hiding this comment. For authentication using certificates, the requesting entity must have the private key. Since dashboard will be calling http endpoints of chaosd, it'll have private key |
||
|
|
||
| #### Chaos Mesh | ||
|
|
||
| Chaos Mesh is by default authenticated using kubernetes token provided. | ||
| If needed, requests could be further protected using SSL certificates. | ||
|
|
||
| #### Dashboard | ||
|
|
||
| In dashboard, basic authentication protocol using username/password can be | ||
| implemented and the data of users can be stored in DB. To implement RBAC | ||
| (Role-based access control), **roles** can be defined to comprise of allowed | ||
| permissions for that role. User and Role and related by many-to-many relationship, | ||
| i.e. user can have many roles and a role can belong to many users. | ||
| Only the user with admin privilege can add/edit users and roles. | ||
|
|
||
| To allow access of a role to a particular chaos nodes (whether physic/kubernetes), | ||
| admin can permit the role to have access to nodes with particular tag, | ||
| which is set in the dashboard. | ||
|
|
||
| ### Web Dashboard | ||
|
|
||
| With this new powerful dashboard, chaos-mesh will be one step closer to | ||
| making **Chaos Engineering as a Service** possible. End user can manage | ||
| multiple node groups (both kubernetes' and physic) from within this dashboard, | ||
| adding/removing cluster configuration from the UI. | ||
|
|
||
| For physic nodes, a URL pointing to chaosd server needs to be provided, | ||
| along with authentication credentials. Whereas for kubernetes' nodes, user | ||
| needs to provide kubeconfig of the cluster. | ||
|
|
||
| It'll also collect prometheus metrics for better visibility of the experiment | ||
| from within the dashboard itself. | ||
|
|
||
| ## Drawbacks | ||
|
|
||
| 1. The dashboard will be storing both authentication credentials and | ||
| kubeconfig in the DB, so there's a security risk unless handled properly | ||
| and securely. | ||
|
|
||
| ## Alternatives | ||
|
|
||
| NA | ||
|
|
||
| ## Unresolved questions | ||
|
|
||
| 1. How to securely store auth credentials in the dashboard? | ||
| (could refer GitHub Secrets) | ||
Add this suggestion to a batch that can be applied as a single commit.
This suggestion is invalid because no changes were made to the code.
Suggestions cannot be applied while the pull request is closed.
Suggestions cannot be applied while viewing a subset of changes.
Only one suggestion per line can be applied in a batch.
Add this suggestion to a batch that can be applied as a single commit.
Applying suggestions on deleted lines is not supported.
You must change the existing code in this line in order to create a valid suggestion.
Outdated suggestions cannot be applied.
This suggestion has been applied or marked resolved.
Suggestions cannot be applied from pending reviews.
Suggestions cannot be applied on multi-line comments.
Suggestions cannot be applied while the pull request is queued to merge.
Suggestion cannot be applied right now. Please check back later.
There was a problem hiding this comment.
Choose a reason for hiding this comment
The reason will be displayed to describe this comment to others. Learn more.
maybe
collect the metrics by Prometheus and show in dashboardis just one way of improve the observability. 😃There was a problem hiding this comment.
Choose a reason for hiding this comment
The reason will be displayed to describe this comment to others. Learn more.
@WangXiangUSTC What do you suggest we could do besides Prometheus integration for this?
Uh oh!
There was an error while loading. Please reload this page.
There was a problem hiding this comment.
Choose a reason for hiding this comment
The reason will be displayed to describe this comment to others. Learn more.
maybe some data of the chaos experiment itself. In fact, I don’t have a definite idea yet
There was a problem hiding this comment.
Choose a reason for hiding this comment
The reason will be displayed to describe this comment to others. Learn more.
Good examples of metrics from Litmus as mentioned in this blog.
I think we must have metrics around pass/fail/awaited for all chaos operations which client is going to perform. We already have one pass metric but we certainly can have more metric around this (like per namespace) to make data more visible and easy to consume.
There was a problem hiding this comment.
Choose a reason for hiding this comment
The reason will be displayed to describe this comment to others. Learn more.
Yeah, I agree with you