Traces Definition
The traces definition input file is used to define all the traces & spans that the data generator should generate for the specified resources. Live examples of the definition file are available here.
The definition file must define 3 sections:
- traceCompletionTimeoutSecs: An integer value representing the number of seconds within which all the spans of a trace tree must be sent. This is usually defined by the platform where the spans data is being sent.
- rootSpans: The list of span definitions where each of these spans is the root span of a trace tree and consists of a tree of spans.
- childSpans: The list of non-root span definitions which compose a trace tree. A child span can be used across multiple trees.
Whether it is a root span or a child span definition, the following fields can be defined for each:
| Field | Is Mandatory? | Description |
|---|---|---|
| name | Yes | Name of the span which must be unique across all root/child spans in the definition. This is copied as it is to the name field of the OpenTelemetry Span object. |
| reportingResource | Yes | The type of the resource reporting this span. During the data posting, for each payload a resource of this type will be sequentially selected from the resource model to post this span. |
| spanKind | No | Maps as it is to the OpenTelemetry SpanKind field. If not defined, it is set as SPAN_KIND_UNSPECIFIED. |
| errorFrequency | No | Defines how frequently this span should be reported as in error state. For example if set to 3, every 3rd time this span is posted, it is reported to be in error state. If this value is not set, this span will never be reported as being in error. Whether to end the whole trace due to this error is specified in the root span. See Error Spans. |
| childSpans | No | List of names of spans that are the immediate child spans for this span in the trace tree. If not set, it remains empty and this span becomes one of the leaf span nodes in the trace tree. |
| spanStartTimePct | No | Override the equally distributed default start time for a span by specifying the percent of total time at which the span should start. For example, if the complete trace is posted every 60 seconds and spanStartTimePct for a particular span is set as 25, the start time is (60*25/100) 15 seconds. If the start time override is specified for a span, end time override must also be provided. |
| spanEndTimePct | No | Override the equally distributed default end time for a span by specifying the percent of total time at which the span should end. For example, if the complete trace is posted every 60 seconds and spanEndTimePct for a particular span is set as 75, the end time is (60*75/100) 45 seconds. If the end time override is specified for a span, start time override must also be provided. The value for spanEndTimePct can be more than 100 to allow for certain use cases. See Span Times. |
| attributes | No | List of key-value pairs in the format <ATTRIBUTE_NAME, VALUE_EXPRESSION> where each pair defines an attribute to be sent for this span and an expression that should be evaluated to generate the value for that attribute. See Attribute Value Expressions. |
| copyResourceAttributes | No | A set of attribute names defined in the reporting resource(s) which should be copied to the span attributes. If the attribute is not available in the reporting resource, it will be sent with an empty string value. |
In addition to the above, the following fields apply to the root spans:
| Field | Is Mandatory? | Description |
|---|---|---|
| payloadCount | Yes | Defines how many times the complete trace which is started by this span should be posted. |
| payloadFrequencySeconds | No | How frequently spans from this tree should be posted. If not defined, a value in the range of 15-traceCompletionTimeoutSecs is selected based on the number of total span nodes in the tree. See Payload Frequency and Trace Tree Parts. |
| copyCount | No | To allow a certain degree of load testing, we can request complete copies of the whole trace tree to be posted. As part of this, each span in the tree will be copied copyCount number of times and posted. While all the data in each copy of the span will remain the same including its attribute values, the trace ID and span ID will be different for each copy. See Trace Copies. |
| spanErrorEndsTrace | No | This is an optional configuration which, if set to true, causes the complete trace to end in error if any error span is encountered in the payload. By default it is false. See Error Spans. |
If the payload frequency is not defined for the root span in the definition, a payload frequency is determined by test data generator tool based on the total number of span nodes. First, a list of possible frequencies is created with a minimum of 15 seconds and the maximum equal to or less than traceCompletionTimeoutSecs. For example, if traceCompletionTimeoutSecs is 90, the list of possible frequencies are (15, 30, 45, 60, 75, 90). The total number of span nodes are divided by 5 and the value obtained is the index of the payload frequency to be set from the possible frequency list. Hence, if a trace tree has 6 span nodes, the index is 1 and the payload frequency is 30 seconds. Obviously, if the (numOfNodes/5) exceeds the list size, the last one is selected.
From the perspective of functional testing requirements of your platform and performance restrictions of this test data generator tool, it is good to have a mechanism where the spans of a trace tree are sent in different payloads, that is, the trace tree is split in different parts. Let us have a quick look at how the tool handles this. If the number of span nodes in the tree are half or more than that of the payload frequency seconds, it is split it into different parts. For example, if total number of nodes is 13 and payload frequency is 15, then 13/15 = 0.867, which is more than 0.5. Hence, the number of tree parts are increased continually until this value becomes less than 0.5. In this case, if we set 2 tree parts instead of the default 1, the payload frequency becomes 15*2 = 30 and the nodes per second value is 13/30 = 0.433, this value is within the limits (0.5). When the data is posted, the payloads for this tree are posted every 15 seconds but the first payload consists of spans 1-6 and the second payload consists of spans 7-13. The payloadCount is adhered to since that is for the complete trace. So if we have payloadCount of 10 for this trace, 20 payloads are posted with each of them being posted every 15 seconds.
Whenever a span is marked to be in an error state, it may mean that the request path represented by the trace has been interrupted and the complete trace must end in error, with all the recursive parent span nodes also being set to error status. We can optionally configure this in the tool by setting the spanErrorEndsTrace as true at the root span level. By default however, if an error span is encountered, just the Span.Status for that span in the OpenTelemetry packet is set to error and processing of any subsequent spans will continue as normal. Let us consider the following trace tree to understand how this works:
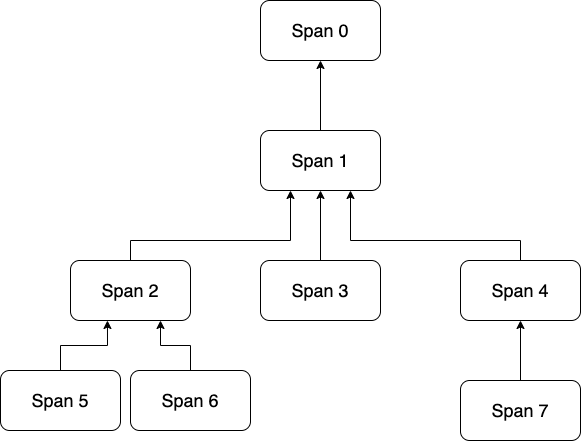
In normal circumstances, the spans is sent in the following order:
Span 6 → Span 5 → Span 2 → Span 3 → Span 7 → Span 4 → Span 1 → Span 0
However, let's say that based on the error frequency set for Span 5, it is determined that in the current payload it must be marked as being in error and also Span 0 (root span) has spanErrorEndsTrace set to true. In this case, the trace must error out and end here. This would be sent out as:
Span 6 (OK) → Span 5 (ERROR) → Span 2 (ERROR) → Span 1 (ERROR) → Span 0 (ERROR).
If there is a copyCount value set for this trace tree, all the copies of the tree and therefore the spans in the current payload are also be marked to be in error state.
By default, the start time and end time of each span is decided by equally distributing the total time of its parent span between all the child spans. Let us consider the example diagram above in the error spans section and assume the payload frequency is 30 seconds, hence, the start time to end time of Span 0 is 0th-30th second. It has only 1 child (Span 1), hence the start time and end time of that span is 0th-30th second. For the child spans of Span 1 however, it is:
- 0th-10th second for Span 2
- 10th-20th second for Span 3
- 20th-30th second for Span 4
You can override this behavior using the spanStartTimePct and spanEndTimePct fields for each span. Let us continue to consider the same example and set spanStartTimePct=10 and spanEndTimePct=90 for Span 2. Now, the start time and end time for Span 2 becomes (3010/100)-(3090/100) 3rd-27th second instead of the default 0th-10th. To represent asynchronous requests the reported end time of the span can exceed the specified frequency duration, hence you can define a value greater than 100 for spanEndTimePct.
The following points should be considered when overriding span times as described in this section:
- Default timed child spans: If the child spans of such a span have default time distribution, the total time distributed is the new overriden time. For example, the start and end times for Span 5 and Span 6 are 3-15 seconds and 15-27 seconds.
- Default timed sibling spans: If you override the times of only some of the spans, it may result in weird patterns. For example, in the payload Span 2 is sent before Span 3 as per the post order traversal but actually it ends at the 27th second while Span 3 ends at the 20th second. This may compound further if the tree is sent in multiple parts.
- Payload frequency calculation: Note that if the tree is sent in parts and some payload frequency is specified in the definition for the trace tree, it is adjusted. For example, as per the logic to split the tree, if the payload frequency for the above tree was set to 15, the tree will be split into two parts (because 8/15>0.5) and therefore the total time in which the tree and therefore all its spans are sent becomes 30 seconds. All the override span time percent calculations are done on this adjusted payload frequency.
- Packet post time vs Packet reported times: There may be a mismatch between the reported end time in the OpenTelemetry packet of a span and the actual time when the same span is being sent. An easy example would be if the spanEndTimePct is set to more than 100, for example, 125 and a payload frequency of 30 seconds. In this case, the packet gets posted at 00:30 but the open telemetry packet has an end time of 00:38.
If the copyCount is set for a trace tree in the root span definition, each span in the tree is copied as it is for copyCount number of times and sent in the payload. All the fields in each copy of the Span remain the same except the ID of the span and the ID of the trace, which it is a part of. The resource it is reported by also changes for each copy. For example, if a copyCount of 10 is set and the reporting resource type is pod for a particular span in that trace tree, 10 copies of that span are generated and each copy is reported by a different pod resource selected sequentially from the resource model. Since it is selected sequentially based on the total number of pod resources defined in the resource definition and the copy count set for the tree, it may result in the same resource reporting copies of a span. However, even in that case, they are packaged in different OpenTelemetry ResourceSpan objects.
The traces generator starts a span posting thread for each different root span (or trace tree). However, if the copy count is determined to be too high, the same trace tree is copied into different thread groups with each group having a lower copy count. But in total, all of them sum up to the same copy count as set in the definition file.