Mnemic
Mnemic is about tracing and profiling applications. The current version is focused on python but other any other language supporting asynchronous programming can be used.
The service can be installed from docker and the client (meaning the application to be profiled) can access it using the host name the the port where it is installed and listening.
The following picture shows the components that are involved in mnemic:
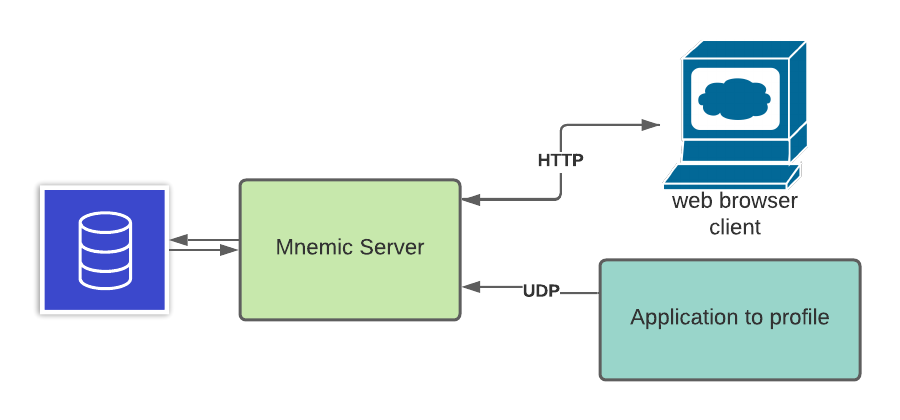
The backend consists of a service that runs as a docker container. It receives messages from the application to profile and stores then in the database. It also exposes a UI client making the profiling data discoverable and visible by a browser session.
In this example we will install the mnemic service on a desktop that has docker installed. Running the following commands:
docker run --name mnemic-db -e POSTGRES_PASSWORD=postgres123 -p 15432:5432 -d jpazarzis/mnemic-db
docker run  --name mnemic-back-end --add-host host.docker.internal:host-gateway -p 12013:12013/udp  -e POSTGRES_CONN_STR='postgresql://postgres:[email protected]:15432/mnemic' -e BACK_END_PORT='12013'  -d jpazarzis/mnemic-backend
docker run --name mnemic-front-end -e POSTGRES_CONN_STR='postgresql://postgres:[email protected]:15432/mnemic'  -e FRONT_END_PORT='12111' -p 12111:12111  -d jpazarzis/mnemic-front-end
will make mnemic available to the environment.
The application to be profiled will be able to communitate with it using port 12013 while the browser front end will use port 12111.
At this point if you access mnemic from the browser (using localhost:12111) the output will look as follows:
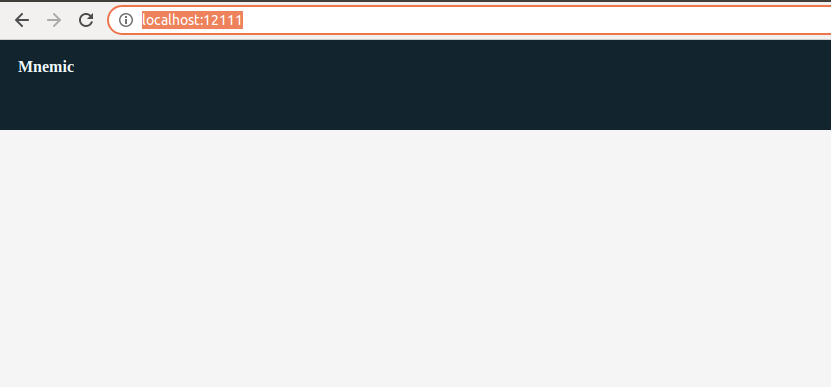
Since we stil do not have any tracing runs the screen is empty.
From your client machine you will need to installt the dolon which exposes the client functionality:
pip3 install dolon
Assuming that dolon is installed to start using the profiler create the following python program:
"""Mnemic hello_word program."""

import asyncio
import random

import tracemalloc

tracemalloc.start()

import dolon.trace_client as tc


async def tracer():
    """Plain vanilla tracer."""
    tracer_name = "hello-world"
    host = "localhost"
    port = 12013
    frequency = 1
    await tc.start_tracer(
        tracer_name,
        frequency,
        host,
        port,
        tc.mem_allocation,
        tc.active_tasks,
        tc.cpu_percent
    )


async def time_and_memory_consuming_func():
    """Allocates some memory for some time!"""
    _ = [i for i in range(10000)]
    await asyncio.sleep(random.uniform(0.1, 3))


async def main():
    """The main function to profile."""
    while 1:
        asyncio.ensure_future(time_and_memory_consuming_func())
        await asyncio.sleep(0.4)


if __name__ == '__main__':
    loop = asyncio.get_event_loop()
    asyncio.ensure_future(tracer())
    loop.run_until_complete(main())