Monitoring Cassandra
✅ Step 1: Monitor your system
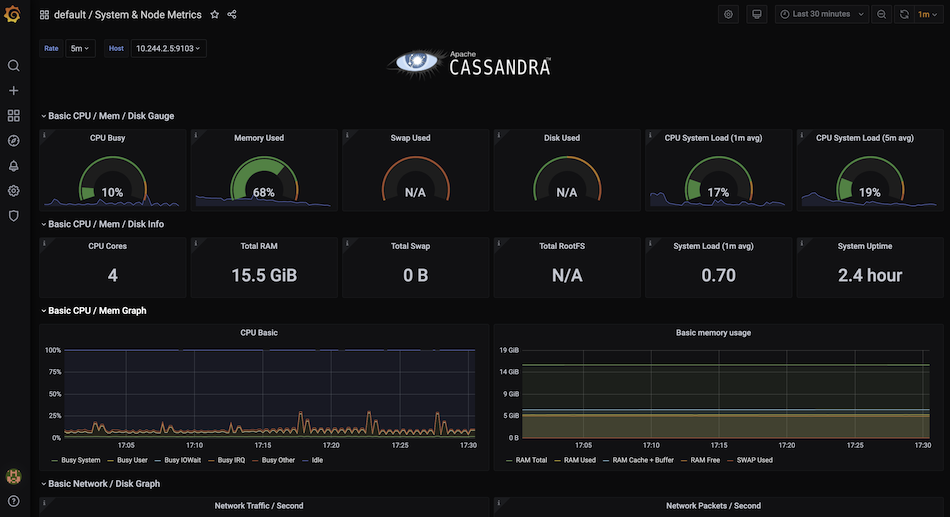
K8ssandra takes monitoring and observability very seriously and provides us with built-in Grafana and Prometheus (but of course you can use external - batteries are included but swappable).
To find the UI for Grafana and Prometheus use the links page in your instance and click on the corresponding Grafana and Prometheus. If running on a local kind cluster navigate to <YOURADDRESS>:8080/prometheus/ and <YOURADDRESS>:8080/grafana/
For Grafana the credentials are:
username: admin
password: admin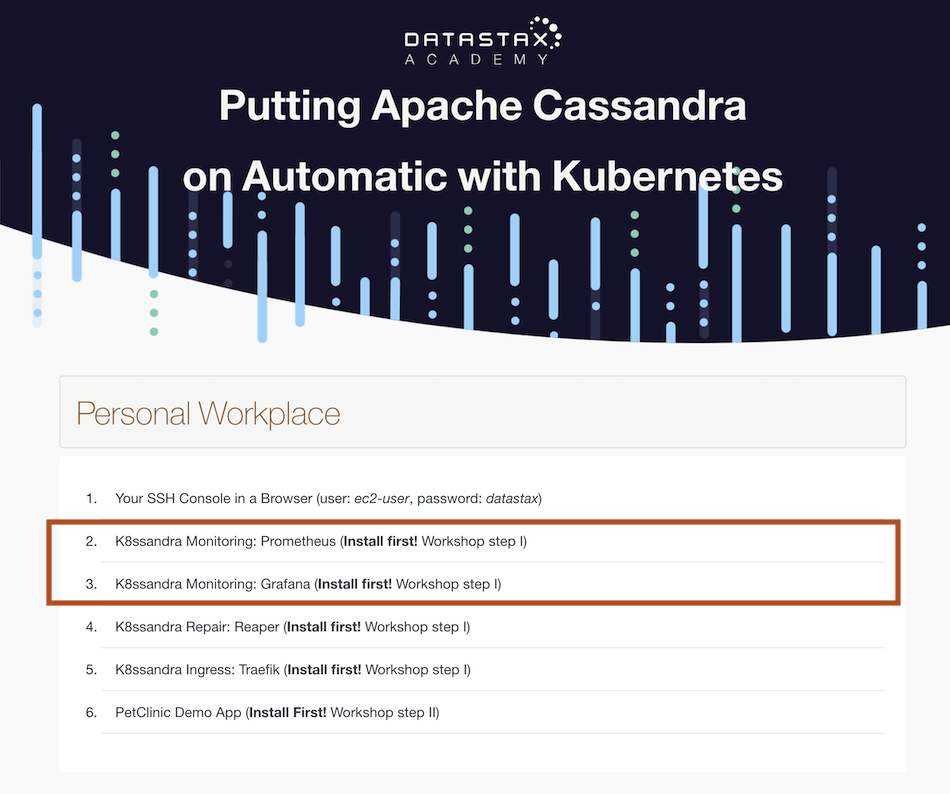
Locate the panel on the left and pick Dashboard > Manage. Then click the ellipsis to show the available dashboards
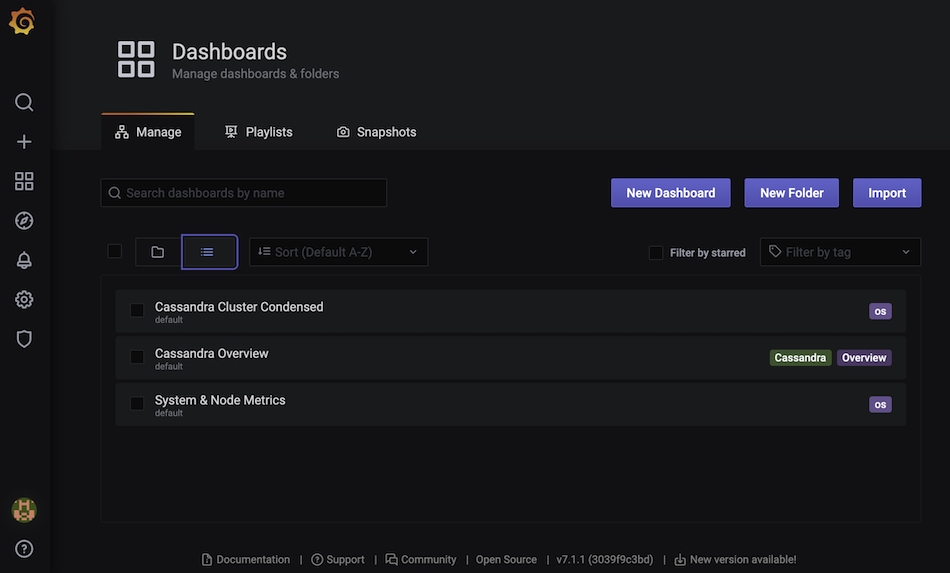
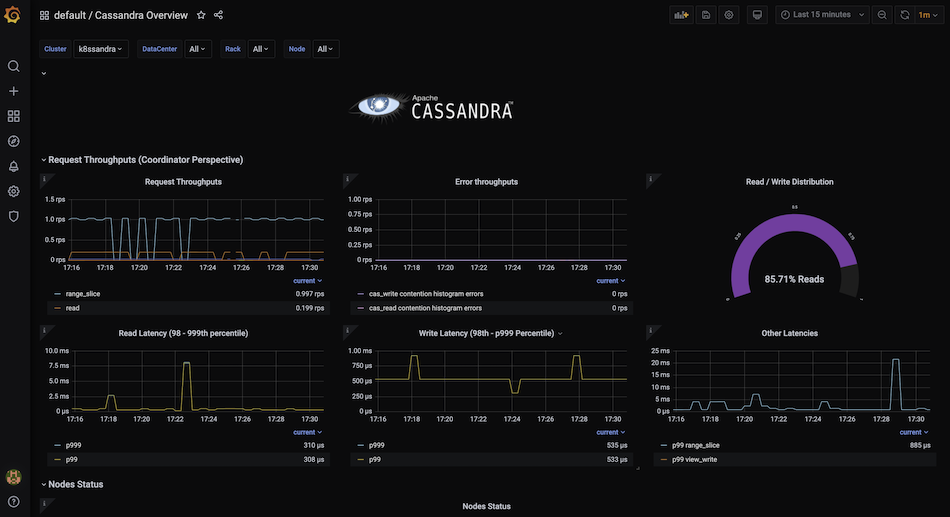
Cassandra Overview
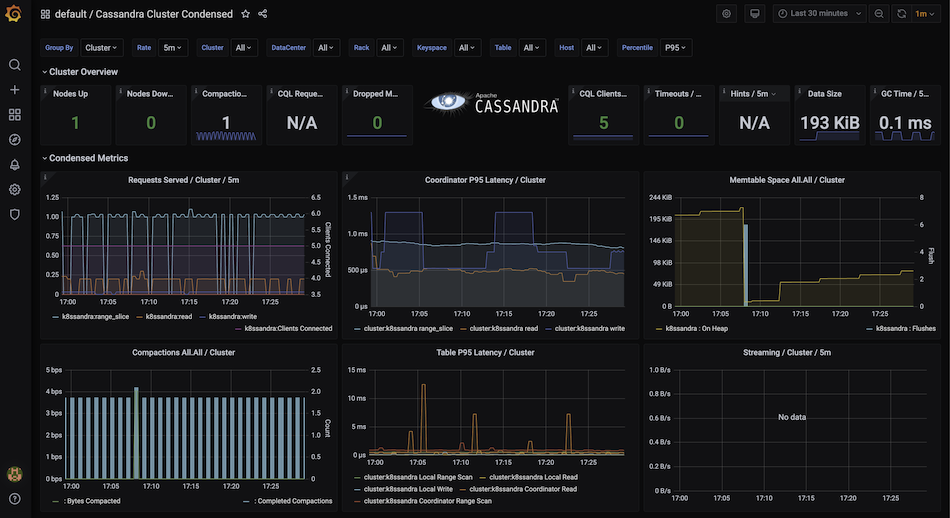
Cassandra Cluster Condenses
Cassandra Node Metrics
Proceed to the Step III