Add introduction of the web report to the docs #404
Conversation
Codecov ReportBase: 78.38% // Head: 78.38% // No change to project coverage 👍
Additional details and impacted files@@ Coverage Diff @@
## master #404 +/- ##
=======================================
Coverage 78.38% 78.38%
=======================================
Files 63 63
Lines 4760 4760
=======================================
Hits 3731 3731
Misses 1029 1029
Flags with carried forward coverage won't be shown. Click here to find out more. Help us with your feedback. Take ten seconds to tell us how you rate us. Have a feature suggestion? Share it here. ☔ View full report at Codecov. |
|
Here is the content of report.rst. ReportWeb ReportYou can analyze an APK sample and produce a beautiful summary report in HTML format through the following command. The meanings of the options:
Here is a demo of the Web Report.
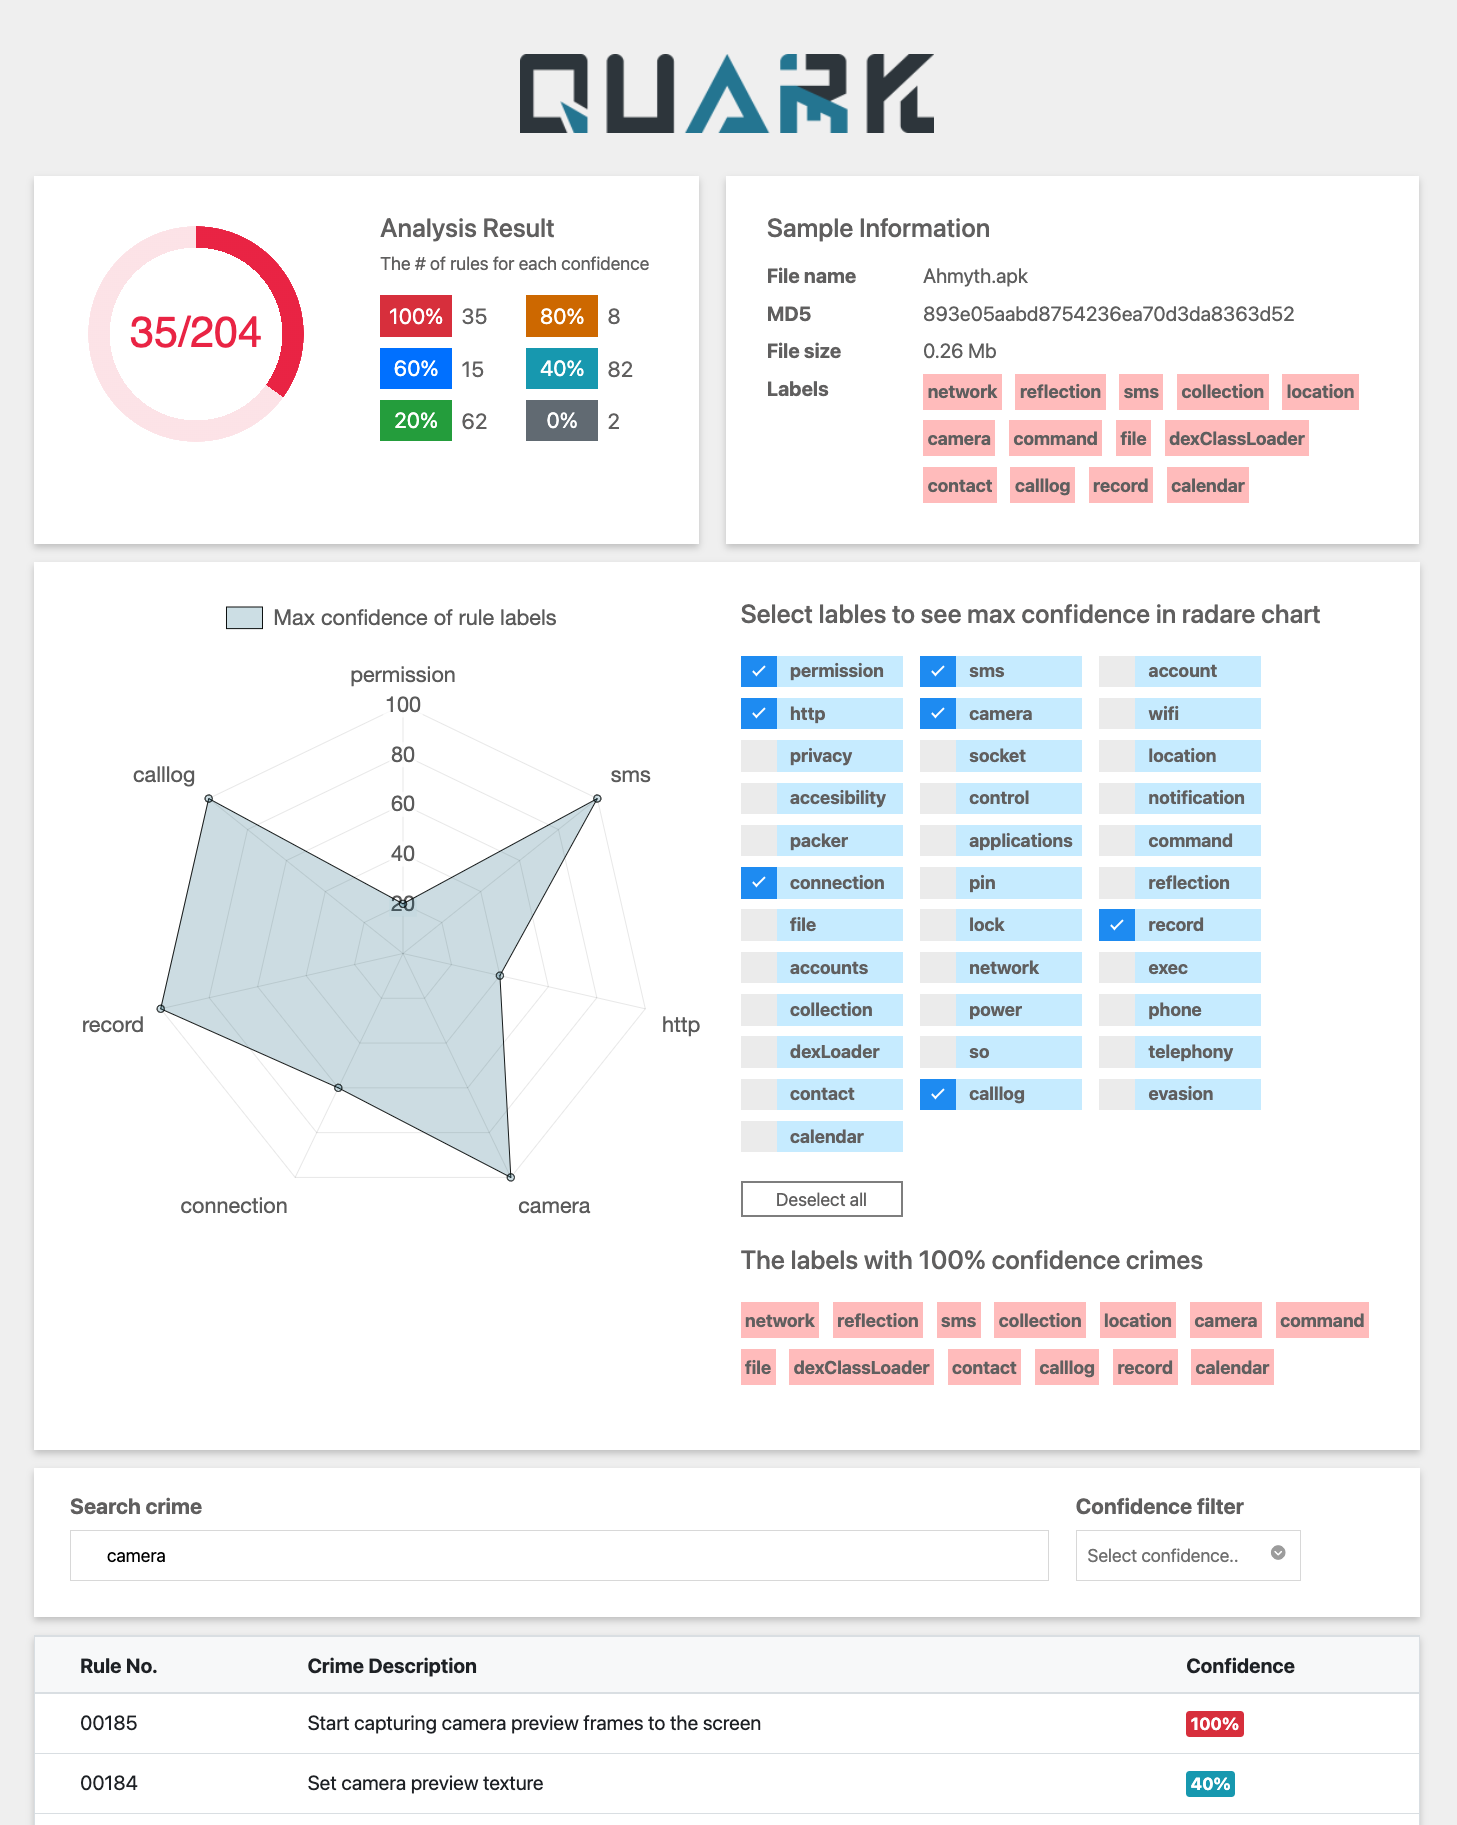
Analysis ResultFirst, this part gives you the statistic of the crimes detected by Quark. There are two sections in this part:
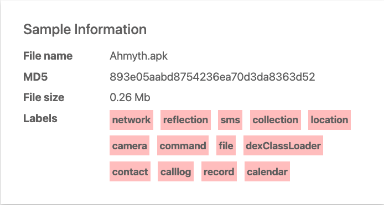
Sample InformationSample Information shows the basic information of the sample, including the file name, MD5 hash value, file size, and the labels of detected rules with 100% confidence. Radar ChartIn this part,
Detected CrimesIn this part,
|


|
@18z Please review the document about the web report. Thank you! |
|
Thank you @zinwang and @haeter525 ! I think we should ensure that in every picture we provide, the content must be clean and tidy. Two suggestions:
Instead of Use
|
|
hi @zinwang I have a new idea. Let's just keep the picture of the whole report and remove all the others. At the top of the document, we show the report directly. For example:
Analysis ResultDescription Sample InformationDescription Radar ChartDescription Label selectionDescription 100% Confidence CrimesDescription Search CrimeDescription Confidence FilterDescription List of Rules and CrimeDescription |
|
@18z I edited it on 11/9. ReportWeb ReportThis report aims to provide an easy-to-read overview of the analysis result of the APK file. We can analyze an APK file and produce a reader-friendly summary report in HTML format with the command below.: The usage of the options: The image below depicts the appearance of the generated Web Report. You can also check this demo The followings are the detailed descriptions of the Web Report. Doughnut ChartThe doughnut chart illustrates the proportion of the crimes with 100% confidence in all crimes detected in the sample. And the fraction number is shown directly in the center of the chart. The feature helps users understand the overall maliciousness in the sample file at first glance. Statistics of CrimesThe statistics show the number of crimes in different confidence levels from 0% to 100%. The higher the level is, the more we are sure the behavior is malicious. And the icons of levels are separated by different colors. Here, we can know the distributions of the malice of the sample. Sample InformationSample Information exhibits the basic information of the sample, including the file name, MD5 hash value, file size, and the labels of detected rules with 100% confidence. The first three pieces of information give identifications of the file. We can use them to find other analyses of the same file on the Internet, then compare the differences. And with the labels of 100% confidence, we can roughly see the malicious behavior in the sample. Or we can compare them between different sample files. Label Selecting AreaDetected labels are presented here. We can choose the labels we want as the dimensions in the radar chart by clicking the check box of each label. Then, the page will plot the radar chart according to our selection. If we want to replot the chart, we can easily use the “unselect button” to uncheck all the labels. Radar ChartThe radar chart presents relations of the confidence level between different labels. With a radar chart, we can quickly find outliers that differ significantly from other dimensions. And we can also use radar charts to compare the similarity between different samples. Labels of 100% confidenceHere it lists the labels of the detected crimes that have 100% confidence again. Search CrimesWe can use the Search Crime field to search crimes with specific strings in crime descriptions. It helps find particular crimes quickly. Confidence FilterWe can filter crimes at specific confidence levels with Confidence Filter. For example, we can see only crime with 60% confidence if we set the filter to 60%. Detected CrimesThe rule numbers, crime descriptions, and the confidence level of the detected crimes are shown in this section. With this information, we can know what the sample does and how malicious the behaviors are. If we want to dig into the detail of the crime, we can use rule numbers to look up Quark Rules. |
Description
This PR aims to close Issue #400.
Document Changes