

A flowing application programming interface for creating Graphviz visualizations using Pydot.
Pydot flow makes it a little easier to assemble flowcharts using Pydot. Each line of code maps to one Node in the graph. Each call to the flow method returns the new Node that you flowed to.
You can, for example, use flow to construct a graph programmatically at each step of a data transformation pipeline - visually documenting a data transformation.
pip install pydot-flowIn this hypothetical copy-and-paste example a graph is constructed using the flow API.
# 0. Import dependencies.
import random
import pydot
from pydot_flow import Chart
from IPython.display import Image


# 1. Define a function for creating a random color code.
def random_color():
    "Generate a random color."
    return "#" + hex(random.randint(0, 0xFFFFFF))[2:].rjust(6, "0")


# 2. Create a Pydot flow Chart.
chart = Chart(
    rankdir="TB",
    splines="false",
    label="Chart",
    labelloc="t",
    fontname="Sans",
    pad=0.2,
    ratio=0.5,
    graph_type="graph",
)

# 3. Set Node defaults.
chart.get_graph().set_node_defaults(style="filled")

# 4. Create the first Node and name it Node 1.
node_1 = chart.create_node(
    src_node_attrs={
        "label": "Node 1",
        "shape": "diamond",
        "color": random_color(),
    }
)

# 5. Flow from Node 1 to Node 2a.
node_2a = node_1.flow(
    src_port="s",
    dst_node_attrs={
        "label": "Node 2a",
        "shape": "oval",
        "color": random_color(),
    },
    edge_attrs={"label": "Edge 1-2a"},
)


# 6. Flow from Node 2a to 3a.
node_3a = node_2a.flow(
    src_port="s",
    dst_node_attrs={
        "name": "Pink Elephants",  # You can optionally name your own Node.
        "label": "Node 3a",
        "shape": "square",
        "color": random_color(),
    },
    edge_attrs={"label": "Edge 2a-3a"},
)

# 7. Return to Node 1 and flow to Node 2b.
node_2b = node_1.flow(
    src_port="s",
    dst_node_attrs={
        "label": "Node 2b",
        "shape": "rectangle",
        "color": random_color(),
    },
    edge_attrs={"label": "Edge 1-2b"},
)

# 8. Flow from Node 2b to Node 2c.
node_2c = node_2b.flow(
    src_port="e",
    dst_node_attrs={
        "label": "Node 2c",
        "shape": "circle",
        "color": random_color(),
    },
    edge_attrs={"label": "Edge 2b-2c"},
    graph=pydot.Subgraph(rank="same"),
)

# 9. Return to Node 2b and flow to Node 3b.
node_3b = node_2b.flow(
    src_port="s",
    dst_node_attrs={
        "label": "Node 3b",
        "shape": "triangle",
        "color": random_color(),
    },
    edge_attrs={"label": "Edge 2b-3b"},
)

# 10. Flow from Node 3b to Node 2c - reference Node 2c by name.
node_3b.flow(
    src_port="e",
    dst_node_attrs={"name": node_2c.get_name()},
    edge_attrs={"label": "Edge 3b-2c"},
).flow( # You can use method chaining.
    src_port="s",
    dst_node_attrs={"name": "Pink Elephants"},
    edge_attrs={"label": "Edge 2c-3a"},
)

# 11. Save the graph image to a file.
chart.get_graph().write_png("output-no-splines.png")

# 12. Output an image in a Jupyter Notebook.
Image(chart.get_graph().create_png(prog="dot"))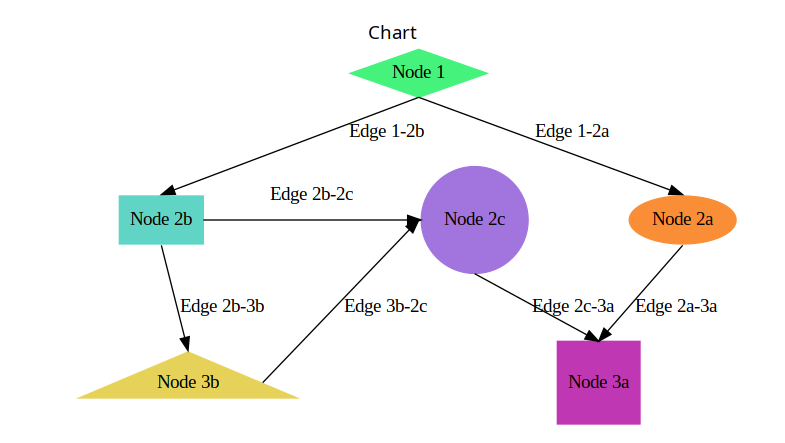
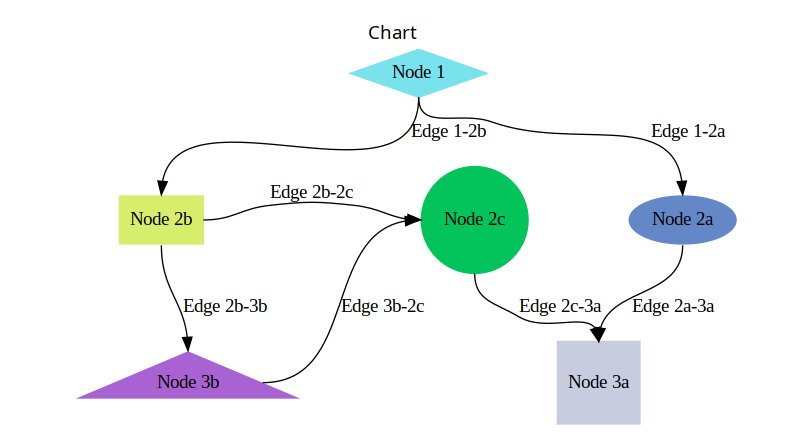
Setting the splines parameter to true in the Chart constructor will yield a chart with splines.
If you have a feature request or run into any issues, feel free to submit an issue or start a discussion. You’re also welcome to reach out directly to one of the authors.