Call and put options can be bought and sold (long and short). They can be combined in interesting ways. This application is intended to help view the payout at expiry when options are chained together.
./options.py --help
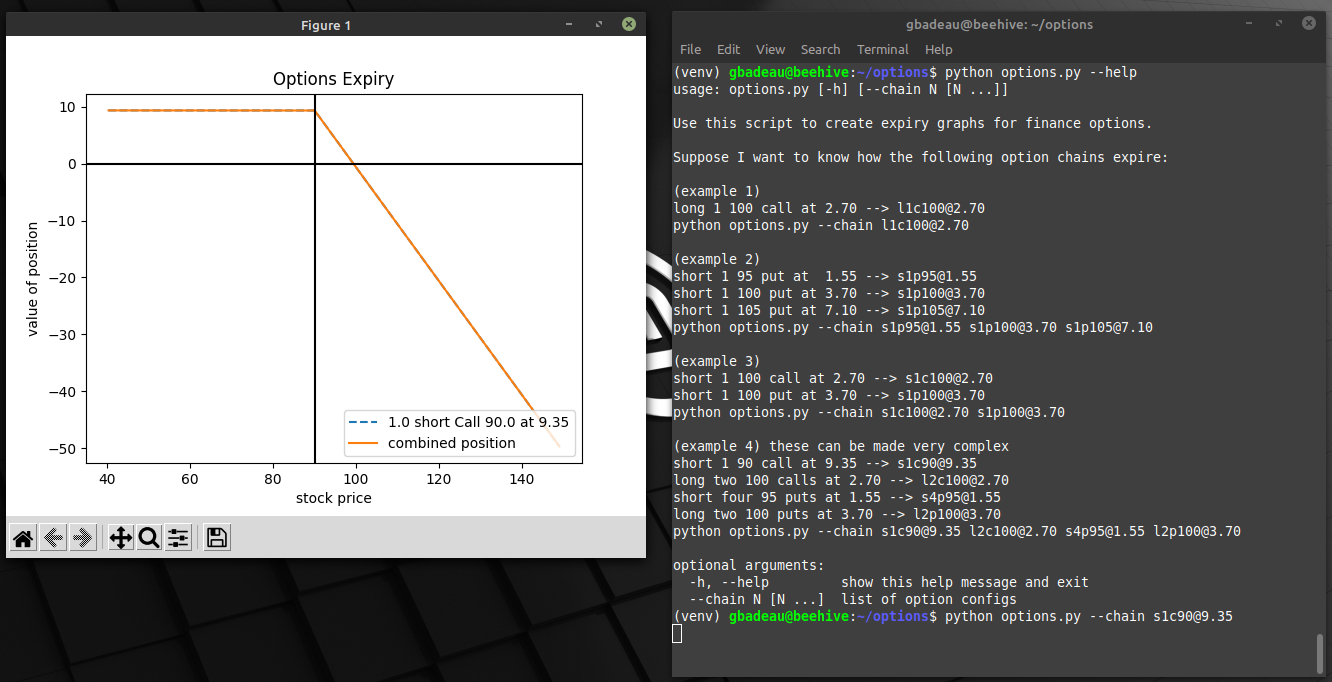
This image is the result of shorting (writing) 1 call contract (100 shares) with a strike of 90 trading at 9.35.
python options.py --chain [email protected]
Since you are writing the call, your maximum profit is the cost of the trade (9.35). If the price of the stock exceeds 90, your return diminishes until the stock price is 90 + 9.35, at which point you break even. If the stock goes above that value, you are at a net loss.
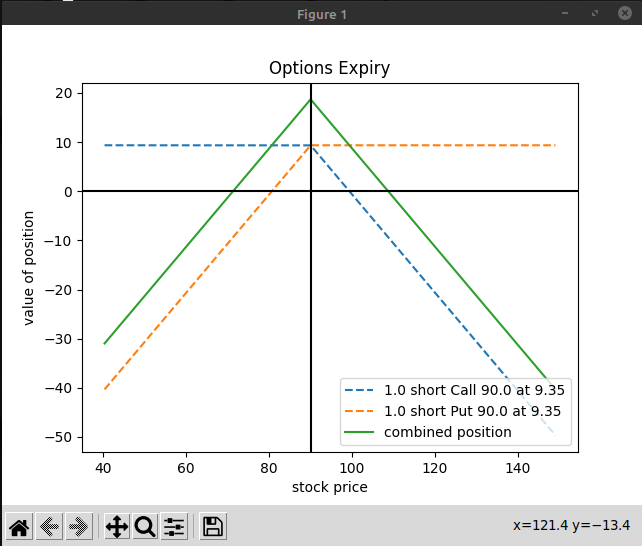
You can chain multiple options together.
For example if you thought the price of a stock was stable (not going up or down) within the expiry window, you could short a call and short a put.
python options.py --chain [email protected] [email protected]