Population choropleth map tutorial#821
Conversation
Submit population choropleth map tutorial.
|
Thanks for your pull request! It looks like this may be your first contribution to a Google open source project. Before we can look at your pull request, you'll need to sign a Contributor License Agreement (CLA). View this failed invocation of the CLA check for more information. For the most up to date status, view the checks section at the bottom of the pull request. |
 jdbcode
left a comment
jdbcode
left a comment
There was a problem hiding this comment.
Hi Ka Hei, great work on the tutorial! I've looked through all section except session 5 and left some comments. I'm sorry it's not the full review yet, but wanted to get you something by the end of the week. Please address the comments when you can and I'll continue my review on whatever are the most recent commits early next week.
| title: Population Choropleth Map | ||
| description: This tutorial demonstrates how to create a population choropleth map, leveraging the Gridded Population of the World dataset and interactive widgets for user interaction. | ||
| author: pinkychow1010 | ||
| tags: remote sensing, population, gwp, socioeconomic data, risk assessment |
There was a problem hiding this comment.
tags cannot have spaces - you'll need to add hyphens for "remote sensing" and "risk assessment"
| --- | ||
|
|
||
| <!-- | ||
| Copyright 2019 The Google Earth Engine Community Authors |
|
|
||
| Understanding social demographics is crucial for assessing the interactions between natural processes and human activities, such as in hazard risk assessment. A choropleth map is a statistical thematic map that uses colors corresponding to an aggregate summary of a geographic characteristic. It's a visually effective approach to convey a large amount of information within political administrative units. | ||
|
|
||
| This tutorial demonstrates the creation of such maps using the [Gridded Population of the World (GPW)](https://sedac.ciesin.columbia.edu/data/collection/gpw-v4) collection for 2020, which models the distribution of population on a continuous global surface with 30 arc-second (approximately 1km) grid cells. It also showcases the creation of an interactive tool to retrieve values of polygons by clicking on the map, which can be useful in an app application. |
There was a problem hiding this comment.
Suggest to rephrase "app application" as "interactive app"
| ## (1) Defining Study Site | ||
|
|
||
| To create a choropleth map, we need polygon layers defining the region boundary. | ||
| In this tutorial, we'll work with administrative level 1 polygons for Thailand from the geoBoundaries Global Database of |
There was a problem hiding this comment.
Can you hyperlink to geoBoundaries catalog entry (https://developers.google.com/earth-engine/datasets/catalog/WM_geoLab_geoBoundaries_600_ADM1)
| Map.setOptions('HYBRID'); | ||
| ``` | ||
|
|
||
| ## (2) Zonal statistics of population density |
There was a problem hiding this comment.
Please use consistent case for section titles - I think sentence case like this is preferred.
| ## (2) Zonal statistics of population density | ||
|
|
||
| Zonal statistics summarize the properties of raster datasets within specified zones or regions. | ||
| In this application, we'll compute population density from the GPW gridded data and summarize it for each province. |
There was a problem hiding this comment.
Can you hyperlink to the data catalog entry for the GPW gridded data (https://developers.google.com/earth-engine/datasets/catalog/CIESIN_GPWv411_GPW_Population_Count)
| }); | ||
|
|
||
| // Compute density: Summing up the population counts within the kernel | ||
| var pop_density = pop.reduceNeighborhood({ |
There was a problem hiding this comment.
I think you can achieve the calculation of pop_density more succinctly using:
var pop_density = pop.reduceResolution(ee.Reducer.sum())
    .reproject(pop.projection().atScale(1000))
It is using a weighted sum reducer with a 1000 meter window.
| Map.addLayer(VisCustom, {}, title); | ||
|
|
||
| // Define visualization parameters | ||
| var vis = { |
There was a problem hiding this comment.
I think the vis is unused and can be removed
|
|
||
| <br> | ||
|
|
||
| 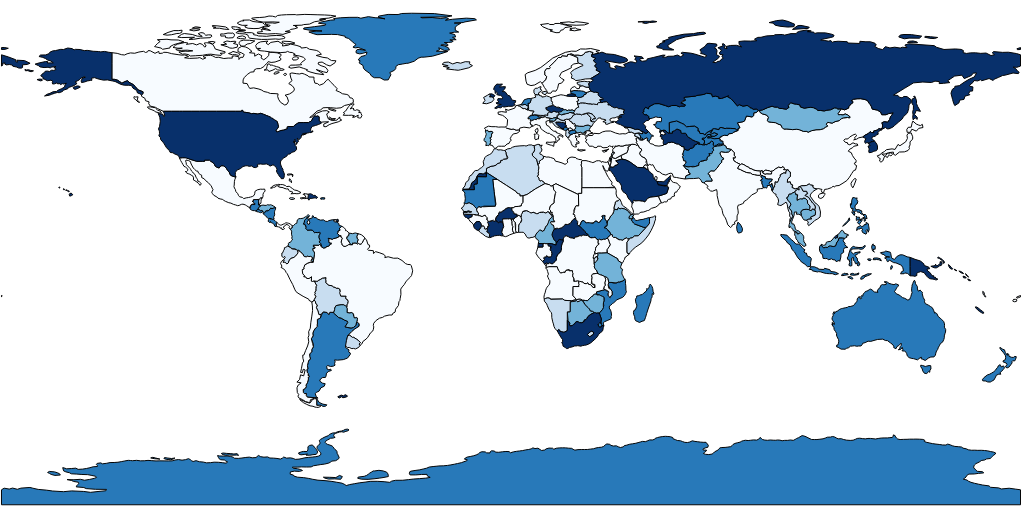 |
There was a problem hiding this comment.
The image will need to be uploaded into the tutorial folder and then use a relative path to define it (just the image file name with extension, like you used at the end of the tutorial)
|
Hi @pinkychow1010 - is there anything I can do to help address the comments? It's so close, it'd be great to get it finalized and published. |
Submit population choropleth map tutorial.