-
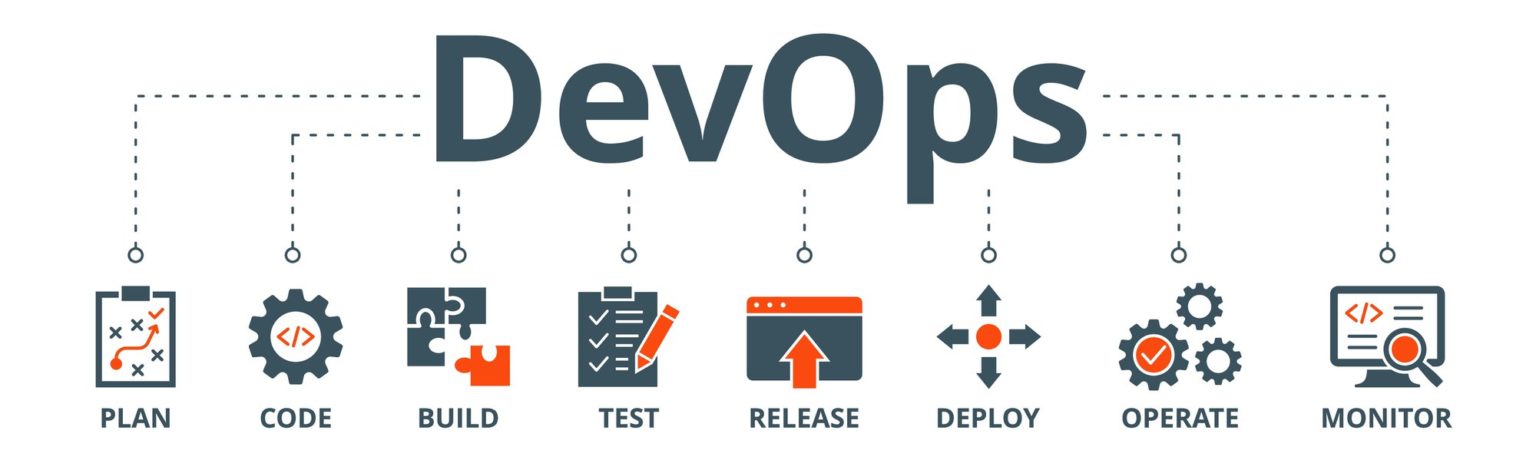
DevOps core technologies, detailed review
OpenTelemetry (often “OTel”) is an open-source, vendor-neutral observability framework that standardizes how you collect and export telemetry data — namely traces, metrics, logs.
OpenTelemetry gives you a unified, open standard for observability, so DevOps can monitor, trace, and diagnose systems more effectively and without vendor lock-in.
Prometheus is an open-source systems and service monitoring tool that:
-
Collects time-series metrics (data points over time) via HTTP pulls from instrumented targets (services, servers, etc.)
-
Stores metrics in a time-series database, with a multidimensional model (metrics + key-value labels)
-
Provides PromQL, a powerful query language to aggregate, filter, and analyze metrics
-
Supports alerting, by defining rules that trigger when certain conditions are met, and integrates with an Alertmanager to route notifications
-
Works well in dynamic, cloud-native environments (e.g. Kubernetes), with service discovery to automatically find new targets

Grafana is an open-source tool for visualizing, monitoring, and alerting on metrics and time-series data
- It connects to many data sources (Prometheus, InfluxDB, Elasticsearch, etc.) and unifies data into dashboards
- It lets teams create custom, interactive dashboards (graphs, charts, heatmaps, etc.) to monitor system/app health
- It supports alerts — notifying when metrics cross thresholds, so teams can act proactively
- In typical DevOps stacks, it’s used together with metric collectors (e.g., Prometheus) — Prometheus gathers the data, Grafana presents it in a human-friendly way

Loki is a log aggregation system by Grafana Labs
- It’s horizontally scalable, multi-tenant, and designed to be cost-efficient
- Unlike many logging systems, it does not index full log contents. Instead, it only indexes metadata/labels per log stream (e.g. “service=web”, “instance=xyz”)
- The actual log lines are stored in compressed chunks (often on object storage)
- You query logs using LogQL, a query language similar in spirit to PromQL (for metrics)
- It integrates well with Grafana (for dashboards & viewing logs) and with Kubernetes / Prometheus-based setups

Datadog is a cloud-based observability and monitoring platform used in DevOps to collect, correlate, and visualize metrics, logs, and traces from infrastructure and applications across an entire stack
- get unified visibility across servers, containers, databases, networks, and services
- detect anomalies and performance issues via real-time alerts
- correlate data (metrics, logs, traces) to speed up root cause analysis
- track “DORA” DevOps metrics (deployment frequency, lead time, etc.)
/DataDog-solution-diagram.7cf704534940c0431f3ce7b025b577084312c19e.png)
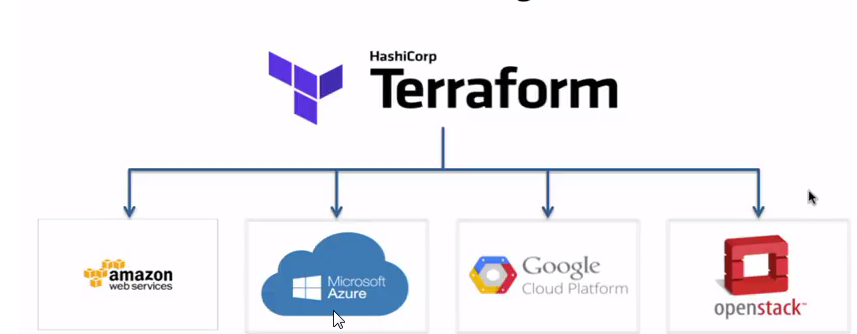
Terraform (by HashiCorp) is an Infrastructure as Code (IaC) tool used in DevOps to declare and automate the provisioning, updating, and teardown of infrastructure (cloud, on-premises, services) via simple configuration files
- You write declarative configs (describing what you want, not how to do it)
- Terraform figures out the execution plan, dependencies, and the steps to realize the desired state
- It maintains a state file to track what’s actually deployed vs. what’s declared
- Supports multiple providers (AWS, Azure, GCP, etc.), so you can manage hybrid or multi-cloud infrastructure
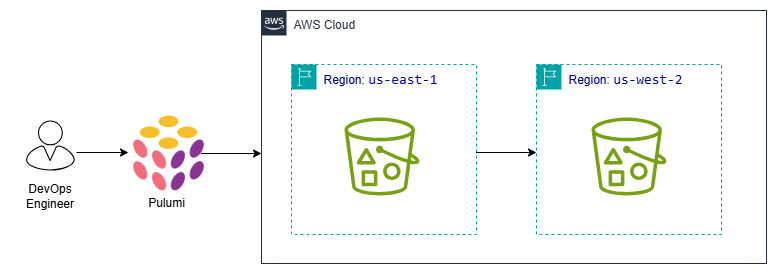
Pulumi is an Infrastructure as Code (IaC) tool/platform that lets DevOps teams define, deploy, and manage cloud infrastructure using general-purpose programming languages (e.g. Python, TypeScript, Go, C#) instead of domain-specific configuration languages
This enables:
- richer logic (loops, conditionals, abstractions) in infrastructure code
- reuse and modularization, with same tooling as application code
- integration into CI/CD pipelines for automated provisioning and updates
- consistent, versioned, testable infrastructure definitions
In DevOps, Pulumi helps bridge development and operations by treating infrastructure like software, improving automation, reproducibility, and maintainability
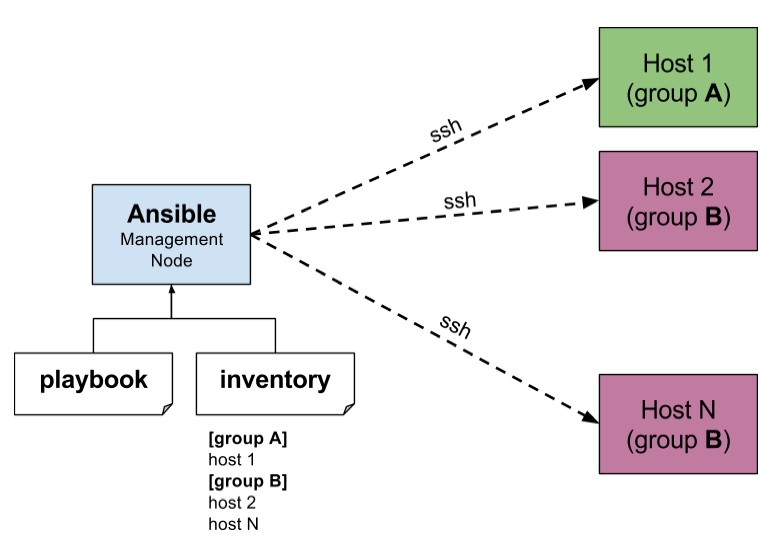
Ansible is an open-source automation tool used in DevOps to manage infrastructure, deploy applications, and orchestrate workflows
Key traits:
- Agentless: It doesn’t require software agents on the target machines; it uses SSH (or WinRM on Windows) to run tasks remotely
- Declarative / Idempotent: You describe the desired state of the system in Ansible playbooks (YAML). Running the same playbook multiple times will not change the system further once it’s in the intended state
- Playbooks & Modules: Work is organized into playbooks (YAML files) composed of tasks that call modules (prebuilt actions)
AWS CloudFormation is an Infrastructure as Code (IaC) service that lets you define, provision, and manage AWS resources via templates written in JSON or YAML
In a DevOps context:
- It treats infrastructure like software — versioned, reviewed, and automated.
- You bundle related resources into a stack, and can update or delete them as a single unit
- Before applying changes, you can generate a change set to preview impacts
- It enforces consistency, repeatability, and automation in deployment pipelines (reduces manual error)

Jenkins is an open-source automation server used in DevOps for implementing CI/CD (Continuous Integration / Continuous Delivery) pipelines
In practice, Jenkins:
- Automates building, testing, and deploying code changes
- Lets you define pipelines as code (via a “Jenkinsfile”) so the workflow is versioned with your source
- Works with agents/workers to distribute tasks across machines
- Supports extensibility through a rich plugin ecosystem, integrating with tools like Git, Docker, Kubernetes, build tools, etc
GitHub Actions is an automation tool built into GitHub that lets you define workflows (via YAML files) to run jobs (build, test, deploy, etc.) in response to events like code pushes, pull requests, schedules, etc
In DevOps, GitHub Actions is used to implement CI/CD (Continuous Integration / Continuous Deployment) pipelines, so that code changes are automatically tested and deployed — reducing manual work, detecting issues early, and speeding up delivery
GitLab CI is the built-in continuous integration and delivery tool inside GitLab — it automates building, testing, and deploying code changes whenever you push commits
Key points:
- Pipelines are defined in a
.gitlab-ci.ymlfile stored in your repo - A pipeline consists of stages (e.g. build → test → deploy), each containing jobs
- Runners execute jobs (they can be GitLab-hosted or self-managed)
- It is central to DevOps because it enables faster feedback loops, fewer manual errors, and more frequent, reliable releases
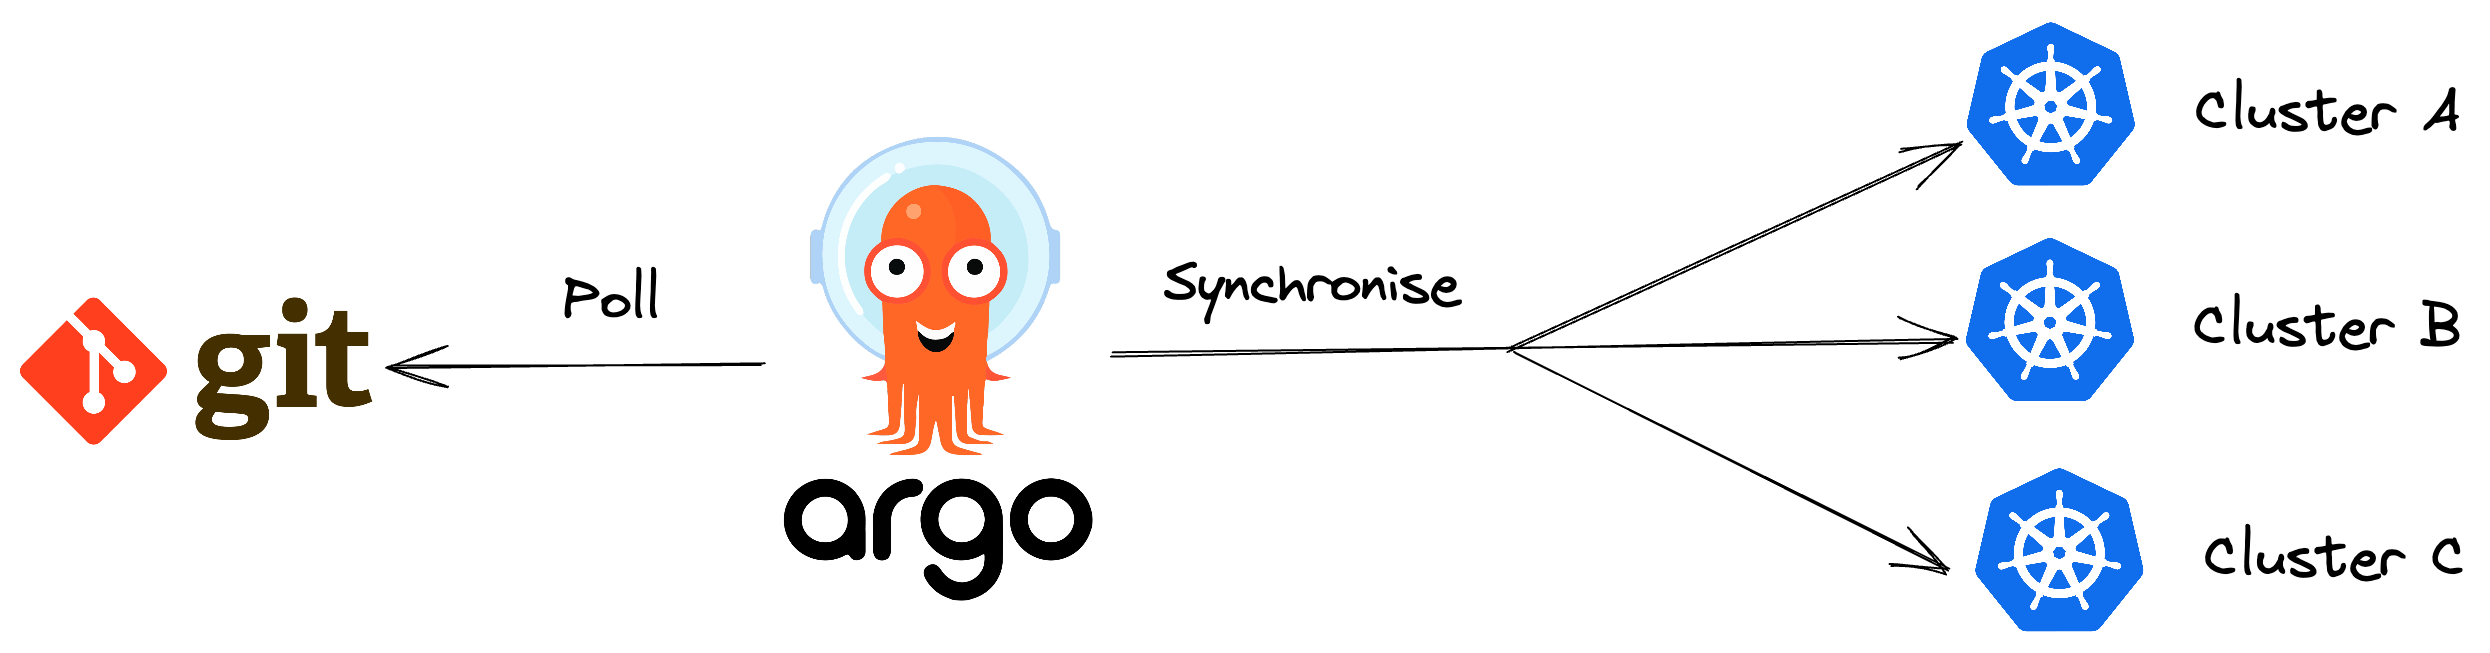
Argo CD is an open-source continuous delivery tool made for Kubernetes
- It follows the GitOps model: your Git repository holds the “desired state” of applications (manifests, configs), and Argo CD continuously pulls from Git and applies changes to the cluster to reconcile any drift
- Argo CD monitors the cluster, detects when the actual state diverges from the desired, and can automatically sync them (or alert/manual sync) to keep them in alignment
- It supports declarative application definitions via YAML, Helm, Kustomize, Jsonnet, etc
- You get a visual UI, CLI, role-based access control (RBAC), and auditability (everything is versioned via Git) as part of the solution
FluxCD is a GitOps-based Continuous Delivery tool for Kubernetes
- You declare the desired state of your apps and infrastructure in Git
- FluxCD runs controllers inside the cluster that continuously reconcile the real cluster state to match what’s in Git
- It supports Helm, Kustomize, image automation, and integrates with common tools
- Changes are auditable (since Git is your source of truth), and rollbacks are easier

Docker is an open-source containerization platform that packages an application and all its dependencies (libraries, runtime, config) into a container. This container can run reliably on any environment—developer laptop, test server, or production—because it encapsulates everything the app needs.
In DevOps, Docker plays a key role as an enabler by:
- Ensuring consistency across environments (no “it works on my machine” surprises)
- Accelerating CI/CD pipelines (build, test, deploy) via automated container tasks
- Improving resource efficiency (containers are lighter than full VMs)

Kubernetes (often “K8s”) is an open-source container orchestration platform that automates deployment, scaling, and management of containerized applications
In a DevOps context, Kubernetes helps by:
- Allowing teams to deploy complex microservices reliably and reproducibly
- Automatically scaling applications up or down based on demand
- Providing self-healing (restarting failed containers, replacing them)
- Enabling declarative “desired state” configuration and rolling upgrades with minimal downtime
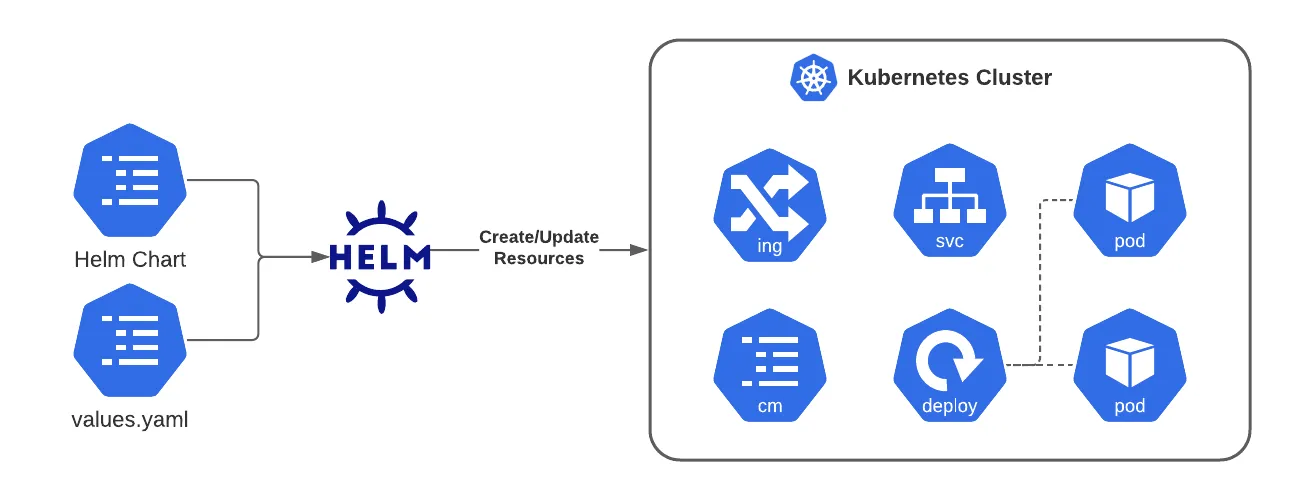
Helm is a package manager for Kubernetes used in DevOps to simplify deploying, upgrading, and managing applications
Key ideas:
- A Helm chart bundles all Kubernetes resource templates (deployment, service, ingress, etc.) + default configuration values into a reusable package
- You install a chart into a cluster as a release — Helm tracks versions, supports upgrades, rollbacks, and configuration overrides
- Helm charts help avoid duplicating YAMLs and make configuration across environments (dev, staging, prod) more consistent and manageable
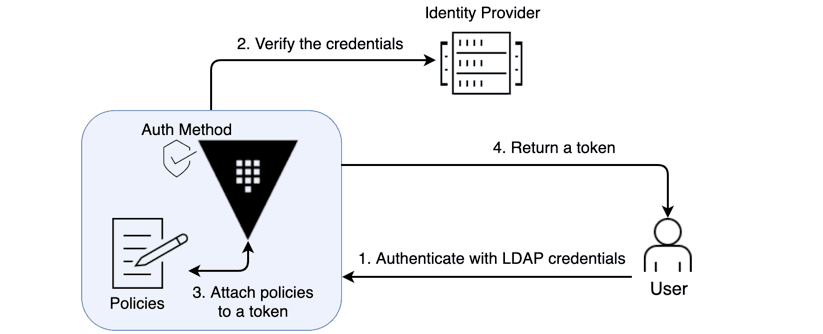
HashiCorp Vault is a secrets management and identity-based security tool used in DevOps to centrally store, manage, and control access to sensitive credentials (e.g. passwords, API keys, certificates, encryption keys)
Key features & benefits:
- Secure storage & encryption — Data is encrypted at rest and in transit
- Dynamic secrets — Vault can generate temporary credentials (e.g. database users) on-demand and revoke them, reducing reliance on long-lived static secrets
- Access control & policies — Uses identity-based authentication (tokens, AppRole, LDAP, etc.) and fine-grained policies to restrict who/what can access which secrets
- Audit & logging — Tracks all access and changes to secrets for compliance and security monitoring
- “Encryption as a service” — Vault can act as a crypto backend, performing encryption/decryption or signing operations without exposing keys to clients
In a DevOps pipeline, Vault helps avoid insecure practices like embedding credentials in code or config files, and enables more secure, automated secret handling across environments (development, staging, production).
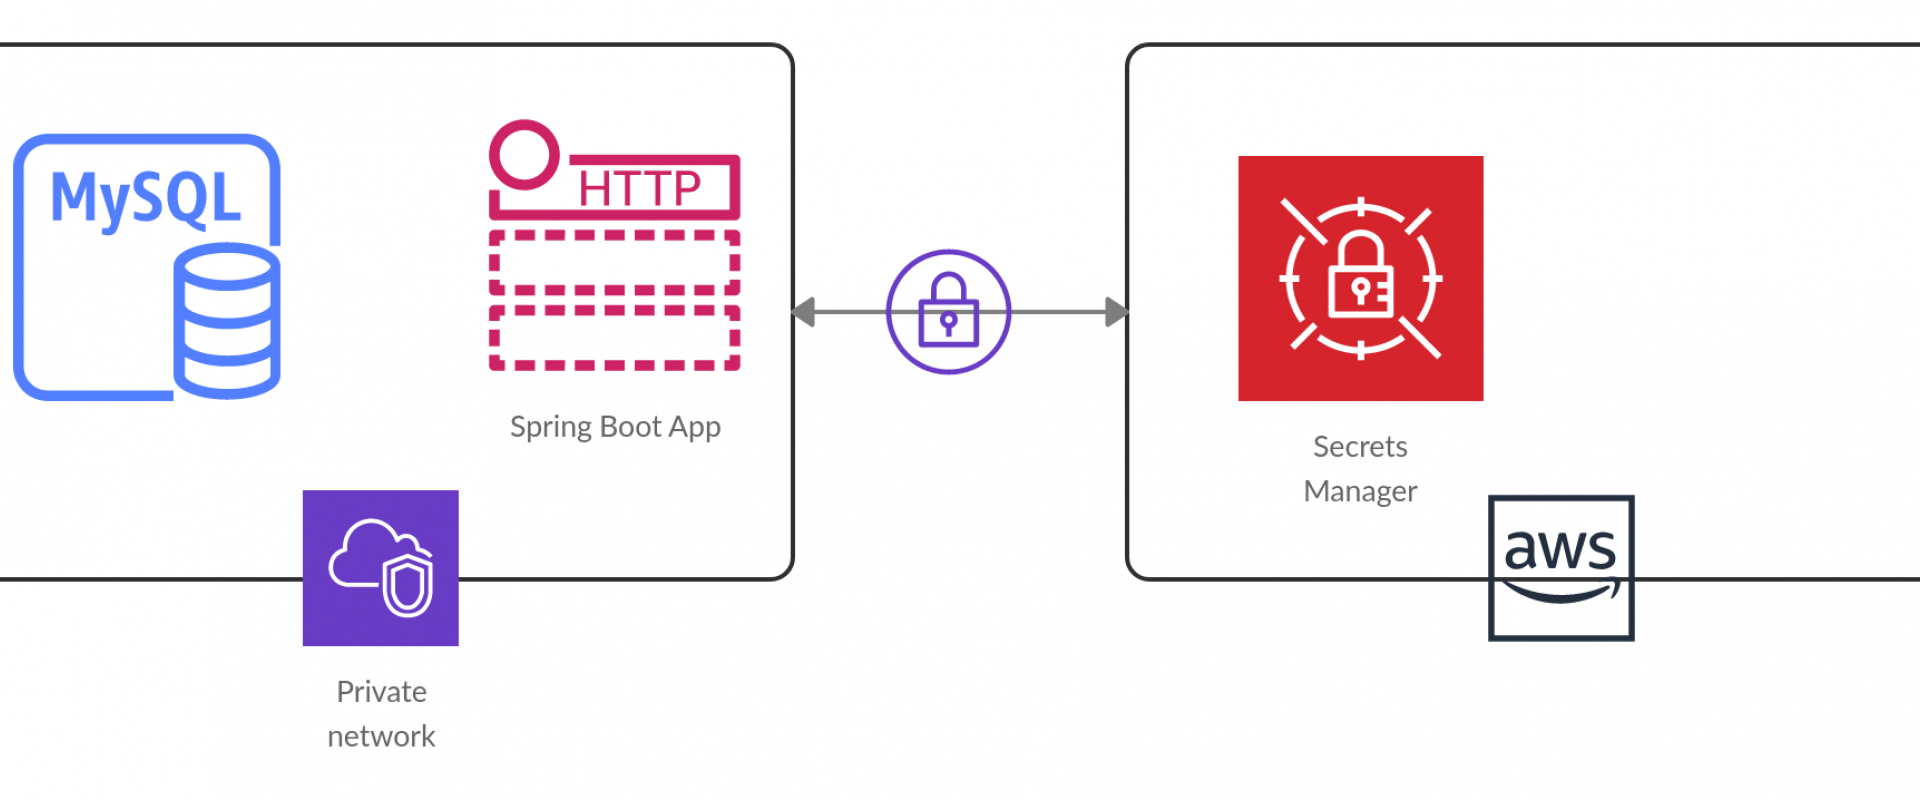
AWS Secrets Manager is a managed service by AWS that lets you securely store, manage, and access “secrets” — such as database credentials, API keys, tokens, etc.
Secrets Manager is used to:
- Remove hard-coded secrets from code and config files
- Dynamically fetch secrets at runtime (e.g. via SDK or CLI)
- Automatically rotate secrets on a schedule (often via AWS Lambda)
- Enforce fine-grained access control via IAM policies
- Audit secret usage through AWS CloudTrail and logging
So, in DevOps pipelines, instead of embedding passwords or keys, your build/deploy jobs or applications call Secrets Manager to retrieve the secrets they need. This improves security, reduces exposure, and centralizes secret management.
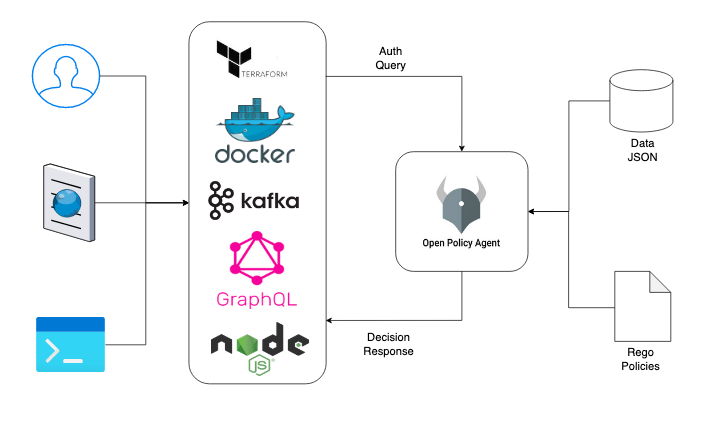
Open Policy Agent (OPA) is an open-source, general-purpose policy engine that enables “policy as code” — letting you write, version, test, and enforce policies automatically rather than manually.
In a DevOps / DevSecOps context, OPA is used to embed policy checks into your pipelines and infrastructure, such as:
- Validating Terraform plans before applying them
- Enforcing Kubernetes admission policies (e.g. “no containers running as root”)
- Authorizing API calls or microservice requests based on rules
- Ensuring configuration files (Dockerfiles, YAML, etc.) comply with standards
OPA uses a declarative language called Rego to express policies, and it evaluates input data (in JSON form) against those policies to return decisions (allow/deny or structured responses)
Because policies are decoupled from application logic, OPA enables a consistent, scalable, and auditable way to enforce governance across your stack.
SonarQube is a static code analysis tool used in DevOps pipelines to continuously inspect code quality, detect bugs, vulnerabilities, code smells, and technical debt.
It integrates into CI/CD workflows (e.g. with Jenkins, Azure DevOps, GitLab) to enforce quality gates — i.e. rules that must be passed before code can be merged or deployed.
In short: SonarQube automates code quality checks so bad code doesn’t slip into production.
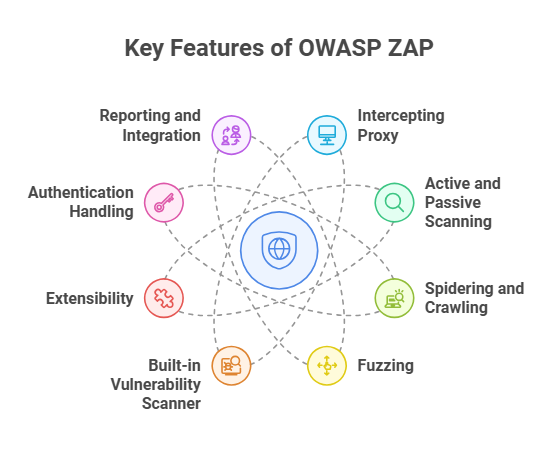
OWASP ZAP (Zed Attack Proxy) is an open-source dynamic application security testing (DAST) tool that you can embed into DevOps pipelines.
In a DevOps / DevSecOps context, ZAP is used to:
- Automatically scan running applications (or APIs) during build/test phases for vulnerabilities like SQL injection, XSS, insecure authentication, etc.
- “Shift left” security by giving feedback early in the pipeline (before deployment)
- Run in headless or containerized modes (e.g. via Docker) with APIs or scripts, enabling integration with CI/CD tools like Jenkins, Azure DevOps, GitLab, etc.
- Produce reports (HTML, XML, etc.) and gates (fail the build if certain severity thresholds are met)
In short: OWASP ZAP helps automate security testing in DevOps pipelines by scanning live apps, catching vulnerabilities early, and enforcing security gates before production.
Sigstore is an open-source framework designed to improve software supply chain security by making it easy to sign, verify, and audit software artifacts (binaries, containers, etc.)
Key ideas:
- It uses short-lived, identity-bound certificates instead of requiring developers to manage long-term signing keys
- It logs all signing events (and metadata) in an immutable transparency log (Rekor) so anyone can audit who signed what, when
- Its components include Cosign (for signing/verification), Fulcio (certificate authority), and Rekor (logging)
- In DevOps pipelines, it enables automated signing & verification of build artifacts, enforcing integrity and traceability with minimal manual key management burden.
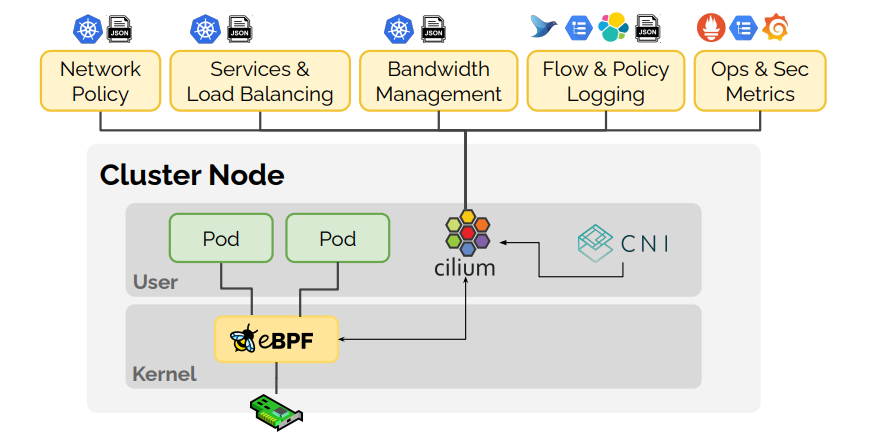
Cilium is an open-source networking, security, and observability layer for containerized/cloud-native environments (especially Kubernetes)
Key points:
- It uses eBPF (extended Berkeley Packet Filter) inside the Linux kernel to run networking and security logic very efficiently
- It can replace or augment traditional CNI (Container Network Interface) plugins and even replace kube-proxy (which handles service traffic) using kernel-level load balancing
- It supports fine-grained network policies (L3 → L7), identity-based security, encryption, and observability (via its companion “Hubble”) without changing application code
In short: Cilium brings high performance, secure, and observable networking to modern container platforms.
Explain the differences between local and remote state, and describe a scenario where state locking becomes critical. How would you recover from a corrupted state file?
1. State Management & Remote Backends
Local vs Remote State:
- Local state stores terraform.tfstate on disk, suitable only for individual/learning scenarios
- Remote state stores state in backends (S3, Azure Blob, Terraform Cloud) enabling team collaboration
State Locking:
Critical during concurrent operations. Example: Two engineers run terraform apply simultaneously without locking → race condition → corrupted state or conflicting changes. DynamoDB (with S3) or Consul provide locking mechanisms.
Recovery from Corruption:
- Restore from backup (S3 versioning, Terraform Cloud automatic backups)
- Use
terraform state pull > backup.tfstateregularly - Manual reconstruction:
terraform importfor each resource - If partially corrupted, edit state file directly (last resort) and validate with
terraform plan
How do you handle versioning of internal Terraform modules across multiple teams? What strategies would you use to prevent breaking changes when updating shared modules?
2. Module Versioning & Dependencies
Strategy:
- Use semantic versioning (v1.2.3) with Git tags
- Reference modules with specific versions:
source = "git::https://github.com/org/module.git?ref=v1.2.0" - Maintain CHANGELOG.md documenting breaking changes
- Use version constraints in consuming code:
version = "~> 1.2"
Preventing Breaking Changes:
- Keep backward compatibility within major versions
- Use separate major versions for breaking changes (v1.x.x → v2.0.0)
- Deprecation warnings before removal (add validation blocks)
- Create integration tests that run against multiple module versions
- Use Dependabot or Renovate for automated version tracking
When would you choose Terraform workspaces over completely separate state files for managing multiple environments (dev, staging, prod)? What are the trade-offs?
3. Workspaces vs. Multiple State Files
Workspaces (terraform workspace): Pros: Single codebase, easy switching, same backend Cons: Shared variables, easy to accidentally deploy to wrong workspace, all environments in one state backend
Best for: Minor variations (dev/staging with similar configs)
Separate State Files (different directories/repos): Pros: Complete isolation, different variable files, independent backends, prevents cross-environment accidents Cons: Code duplication, more maintenance
Best for: Production isolation, different architectures per environment, compliance requirements
Recommendation: Use separate state files for production, workspaces for lower environments only.
Demonstrate how you would use dynamic blocks with for_each to create multiple nested resources (e.g., security group rules from a complex map). How do you handle optional nested blocks?
4. Dynamic Blocks & Complex Data Structures
variable "security_rules" {
  type = map(object({
    from_port   = number
    to_port     = number
    protocol    = string
    cidr_blocks = list(string)
    description = optional(string)
  }))
}

resource "aws_security_group" "example" {
  name = "example"

  dynamic "ingress" {
    for_each = var.security_rules
    content {
      from_port   = ingress.value.from_port
      to_port     = ingress.value.to_port
      protocol    = ingress.value.protocol
      cidr_blocks = ingress.value.cidr_blocks
      description = try(ingress.value.description, null)
    }
  }
}
Handling Optional Blocks:
- Use
try()function for optional attributes - Set
for_eachto empty map/list to skip block entirely:for_each = var.enable_feature ? [1] : [] - Use
lookup()with defaults for missing keys
You need to import 50+ existing AWS resources into Terraform management. Walk through your approach, including how you'd handle resources with dependencies and how you'd validate the import was successful.
5. Import & State Migration
Approach:
- Discovery: Document all resources with AWS CLI/Console, create spreadsheet
- Generate Config: Use
terraform importcombined withterraform showor tools liketerraformer - Import Strategy:
# Import in dependency order (VPC → Subnets → EC2) terraform import aws_vpc.main vpc-12345 terraform import aws_subnet.private[0] subnet-67890 - Batch Scripting:
while IFS=, read -r resource_type resource_name resource_id; do
  terraform import "$resource_type.$resource_name" "$resource_id"
done < import_list.csv
- Validation:
- Run
terraform plan→ should show no changes - Use
terraform state listto verify all resources imported - Test with
terraform refreshto ensure state accuracy
- Run
When would you consider writing a custom Terraform provider? Describe the key components (schema, CRUD operations) and how you'd test it.
6. Custom Provider Development
When to Build Custom Provider:
- Internal APIs without existing providers
- Legacy systems needing IaC management
- Specialized hardware/services
- Custom business logic requirements
Key Components:
// Schema definition
func resourceServer() *schema.Resource {
    return &schema.Resource{
        Create: resourceServerCreate,
        Read:   resourceServerRead,
        Update: resourceServerUpdate,
        Delete: resourceServerDelete,
        Schema: map[string]*schema.Schema{
            "name": {Type: schema.TypeString, Required: true},
        },
    }
}
CRUD Operations: Implement Create, Read, Update, Delete functions that interact with API
Testing:
- Unit tests with mock API responses
- Acceptance tests:
TF_ACC=1 go test - Test against actual API in isolated environment
How would you use Terraform's lifecycle meta-arguments (create_before_destroy, prevent_destroy) to achieve zero-downtime deployments for critical infrastructure like load balancers or databases?
7. Zero-Downtime Deployments
Key Lifecycle Arguments:
resource "aws_launch_template" "app" {
  # ... configuration

  lifecycle {
    create_before_destroy = true  # Create new before destroying old
  }
}

resource "aws_db_instance" "prod" {
  # ... configuration

  lifecycle {
    prevent_destroy = true  # Prevent accidental deletion
    ignore_changes = [password]  # Ignore external changes
  }
}
Strategy for Load Balancers:
- Create new LB/target group with
create_before_destroy - Attach new instances to new target group
- Update DNS/Route53 with weighted routing (gradual cutover)
- Old LB destroyed only after new is healthy
For Blue-Green Deployments:
- Use
countorfor_eachwith conditional logic - Deploy new environment (green) alongside existing (blue)
- Switch traffic, then destroy blue in next apply
What's your approach to testing Terraform code? Compare unit testing (with tools like terraform-compliance or Checkov), integration testing, and policy-as-code frameworks like Sentinel or OPA.
8. Testing Strategies
Unit Testing:
- terraform validate: Syntax/configuration validation
- Checkov/tfsec: Static analysis for security issues
- terraform-compliance: BDD-style policy testing
Feature: S3 Security
  Scenario: S3 buckets must have encryption
    Given I have aws_s3_bucket defined
    Then it must have server_side_encryption_configuration
Integration Testing:
- Terratest (Go-based): Deploys real infrastructure, validates, destroys
terraform.InitAndApply(t, terraformOptions)
defer terraform.Destroy(t, terraformOptions)
// Validate outputs- kitchen-terraform: Ruby-based integration testing
Policy-as-Code:
- Sentinel (Terraform Cloud): Pre-apply policy enforcement
- OPA (Open Policy Agent): Rego-based policy evaluation
- Check cost estimates, security posture, compliance before apply
How do you manage sensitive variables and outputs in Terraform? Discuss the pros and cons of using native sensitive flags vs. external secret management solutions (Vault, AWS Secrets Manager).
9. Handling Secrets & Sensitive Data
Native Terraform Approach:
variable "db_password" {
  type      = string
  sensitive = true  # Masks in output
}

output "connection_string" {
  value     = "..."
  sensitive = true  # Hidden from console
}
Limitations: Still stored in state file in plaintext
External Secret Management (Recommended):
Vault Integration:
data "vault_generic_secret" "db_creds" {
  path = "secret/database"
}

resource "aws_db_instance" "db" {
  password = data.vault_generic_secret.db_creds.data["password"]
}
AWS Secrets Manager:
data "aws_secretsmanager_secret_version" "db_pass" {
  secret_id = "prod/db/password"
}
Best Practices:
- Never commit secrets to VCS
- Use .gitignore for terraform.tfvars with secrets
- Encrypt state files at rest (S3 encryption, Terraform Cloud)
- Rotate secrets outside Terraform lifecycle
- Use IAM roles/service principals instead of static credentials
Your production infrastructure has drifted from the Terraform state due to manual changes. How would you detect this drift, and what's your strategy for reconciling the differences without causing downtime?
10. Drift Detection & Remediation
Detection Methods:
- Manual Detection:
terraform plan -refresh-only  # Shows drift without proposing changes
terraform plan # Shows both drift and planned changes- Automated Detection:
- Terraform Cloud: Automated drift detection runs
- AWS Config/Azure Policy: Cloud-native drift detection
- Custom scripts with
terraform plan -detailed-exitcode(exit code 2 = drift)
Remediation Strategies:
Option 1 - Import Manual Changes:
# Someone manually modified security group
terraform plan  # Shows diff
terraform apply -refresh-only  # Update state to match reality
# Then update code to match
Option 2 - Revert to Terraform State:
terraform apply # Forces infrastructure back to codeOption 3 - Selective Import:
terraform state rm aws_instance.web  # Remove from state
terraform import aws_instance.web i-12345  # Re-import current state
terraform plan  # Review differences
# Update code to match or apply to revert
Prevention:
- Implement RBAC restricting manual changes
- Use AWS Service Control Policies (SCPs) to prevent unmanaged changes
- Enable CloudTrail/audit logging
- Regular drift detection in CI/CD pipeline
- Use
lifecycle { prevent_destroy = true }for critical resources
1. Explain the difference between EC2 instance types and when you would use each family
EC2 instances are categorized into families: General Purpose (T3, M5) for balanced workloads, Compute Optimized (C5) for CPU-intensive tasks, Memory Optimized (R5, X1) for memory-heavy applications like databases, Storage Optimized (I3, D2) for high I/O operations, and Accelerated Computing (P3, G4) for GPU workloads. For example, use T3 for web servers with burstable CPU needs, R5 for Redis caches, and C5 for batch processing jobs.
2. How would you implement a highly available and fault-tolerant architecture in AWS?
Use multiple Availability Zones with load balancers (ALB/NLB) distributing traffic across instances in each AZ. Implement Auto Scaling Groups to automatically replace unhealthy instances. Use RDS Multi-AZ for database redundancy, S3 for durable storage with cross-region replication if needed, and Route 53 for DNS failover. Add CloudWatch alarms to monitor health and trigger automated responses. This ensures no single point of failure.
3. Describe VPC networking components and how they work together
A VPC provides isolated network space. Key components include: Subnets (public/private) that segment your network, Internet Gateway for public internet access, NAT Gateway for private subnet outbound traffic, Route Tables defining traffic routing rules, Security Groups (stateful firewalls at instance level), and NACLs (stateless firewalls at subnet level). VPC Peering or Transit Gateway connects multiple VPCs. This creates a secure, controlled network environment.
4. Explain the differences between IAM roles, policies, and users
IAM Users are permanent identities for people or services with long-term credentials. IAM Roles are temporary identities that can be assumed by users, services, or AWS resources without embedded credentials. IAM Policies are JSON documents defining permissions that attach to users, groups, or roles. Best practice: use roles for EC2 instances and Lambda functions rather than embedding access keys, and follow least privilege principle in policies.
5. How would you optimize AWS costs for a production environment?
Implement Reserved Instances or Savings Plans for predictable workloads (up to 72% savings). Use Spot Instances for fault-tolerant batch jobs. Right-size instances using AWS Compute Optimizer recommendations. Enable S3 lifecycle policies to move data to cheaper storage classes (Glacier, Intelligent-Tiering). Delete unused EBS volumes and snapshots. Set up AWS Budgets and Cost Anomaly Detection. Use Auto Scaling to match capacity with demand.
6. Explain AWS Lambda cold starts and how to mitigate them
Cold starts occur when Lambda initializes a new execution environment, adding 100ms-5s latency. They happen when: function is invoked for first time, after being idle, or when scaling up. Mitigations include: using Provisioned Concurrency to keep environments warm, minimizing deployment package size, choosing runtime efficiently (Node.js/Python start faster than Java), implementing initialization code outside handler, and using Lambda SnapStart for Java functions.
7. How do you implement CI/CD pipelines in AWS?
Use CodePipeline as orchestration tool connecting: CodeCommit/GitHub for source control, CodeBuild for compiling and testing code, and CodeDeploy for deploying to EC2, ECS, or Lambda. Integrate with CloudFormation or Terraform for infrastructure as code. Add manual approval stages for production. Use artifacts stored in S3, implement blue-green or canary deployments, and integrate CloudWatch for monitoring. Alternative: use Jenkins on EC2 with AWS CLI/SDKs.
8. Explain the difference between Application Load Balancer and Network Load Balancer
ALB operates at Layer 7 (HTTP/HTTPS), supports path-based and host-based routing, integrates with WAF, handles SSL termination, and is ideal for microservices. NLB operates at Layer 4 (TCP/UDP), handles millions of requests per second with ultra-low latency, preserves source IP, supports static IPs, and is best for extreme performance needs or non-HTTP protocols. ALB is more feature-rich; NLB is faster and simpler.
9. How would you secure secrets and sensitive data in AWS?
Use AWS Secrets Manager or Systems Manager Parameter Store (encrypted) for storing credentials, API keys, and connection strings. Enable automatic rotation for database credentials. Use KMS for encryption key management. Never hardcode secrets in code or environment variables. Implement IAM policies restricting access to secrets. For applications, use IAM roles to retrieve secrets at runtime. Encrypt data at rest (EBS, S3, RDS) and in transit (TLS).
10. Describe your approach to monitoring and logging in AWS
Implement CloudWatch for metrics, logs, and alarms. Use CloudWatch Logs Insights for log analysis. Enable VPC Flow Logs, CloudTrail for API auditing, and AWS Config for resource compliance. Set up CloudWatch Dashboards for visibility. Use X-Ray for distributed tracing. Aggregate logs to centralized location (S3 or ELK stack). Create SNS topics for alarm notifications. Implement custom metrics for application-specific monitoring and set up automated remediation with Lambda.
1. How would you design a scalable, fault-tolerant, multi-region architecture for a microservices application so as to minimize latency and downtime?
Goal: Deploy microservices across multiple regions (e.g., AWS us-east-1, eu-west-1) for global low-latency access (<100ms), auto-scaling to handle traffic spikes, and 99.99% uptime via redundancy.
- Use managed Kubernetes (EKS/GKE) clusters per region, with auto-scaling node groups (e.g., scale from 3-50 nodes based on CPU >70%).
- Deploy via IaC (Terraform) for consistent, reproducible setups.
- Example: Horizontal Pod Autoscaler (HPA) in K8s scales pods from 5-100 replicas during peak loads.
- Implement global load balancing with anycast routing (e.g., AWS Global Accelerator) to route traffic to nearest region.
- Service mesh (Istio/Linkerd) for inter-service traffic with mTLS encryption and circuit breakers.
- Example: API Gateway (Kong) proxies requests to regional services, caching responses via Redis for <50ms edge latency.
- Blue-green or canary deployments via CI/CD (ArgoCD) to roll out updates without interruption.
- Multi-region failover with health checks (e.g., Route 53 DNS health checks trigger traffic shift in <1min).
- Example: Deploy v2 to 10% traffic in eu-west-1; monitor error rates, then ramp to 100% if stable.
- Eventual consistency with CQRS/ES patterns; use geo-replicated databases (DynamoDB Global Tables or CockroachDB).
- Async messaging (Kafka/SQS) for cross-region data sync, with dead-letter queues for retries.
- Example: User service writes to regional DynamoDB; Kafka replicates events to other regions, ensuring data availability post-failure.
- Centralized logging (ELK Stack) and metrics (Prometheus/Grafana) with regional aggregation.
- Chaos engineering (Litmus) to simulate failures and validate resilience.
- Example: Alert on latency >200ms via PagerDuty; auto-remediate by draining unhealthy pods.
Trade-offs: Higher costs (~2x for multi-region) but gains in resilience; start with 2 regions, expand based on user distribution. Test with load tools like Locust for end-to-end validation.
.jpg)
2. If we currently host everything in a single cloud provider, how would you evaluate and plan a multi-cloud or hybrid cloud migration (or architecture)?
Assess feasibility and alignment with business goals before migration.
- Current State Audit: Inventory workloads (e.g., VMs, databases, apps) using tools like AWS Cost Explorer or Azure Migrate. Identify dependencies, costs, and performance bottlenecks.
- Risk & Benefit Analysis: Evaluate risks (e.g., data sovereignty, vendor lock-in) vs. benefits (e.g., 99.99% uptime via failover). Use a scoring matrix: High-risk workloads (e.g., PCI-compliant DBs) stay single-cloud initially.
- Requirements Gathering: Survey stakeholders on needs like cost savings (target 20% reduction) or resilience (e.g., geo-redundancy). Conduct proof-of-concepts (PoCs) for key services.
- Gap Analysis: Map services to target clouds (e.g., AWS S3 → Azure Blob Storage) and hybrid tools (e.g., on-prem VMware + cloud).
Develop a phased roadmap with governance and automation.
- Strategy Selection: Choose multi-cloud (e.g., AWS for compute, GCP for AI) or hybrid (e.g., on-prem for legacy + cloud for scalability). Prioritize based on criticality: Tier 1 (mission-critical) first.
- Architecture Design: Use IaC (Terraform) for portable infra. Implement cross-cloud networking (e.g., Aviatrix) and data sync (e.g., AWS DMS to Azure).
- Migration Roadmap: Phase it: Lift-and-shift non-critical apps (e.g., dev environments), refactor others (e.g., microservices to Kubernetes on EKS/AKS). Timeline: 3-6 months per phase, with rollback plans.
- Governance & Ops: Set policies (e.g., multi-cloud cost tagging) and monitoring (e.g., Datadog). Train teams on tools like Kubernetes for orchestration.
- Multi-Cloud: Migrate e-commerce site from AWS to GCP for ML features; use Anthos for unified K8s management, reducing downtime by 40%.
- Hybrid: Shift analytics from on-prem Hadoop to Azure Synapse, syncing data via Azure Data Factory; retains on-prem for compliance-sensitive workloads.
This approach minimizes disruption while maximizing resilience—start small, iterate based on metrics.
3. How do you structure Infrastructure as Code (IaC) modules and environments (dev/staging/prod) to maximize reuse, safety, and clarity?
To maximize reuse (modular components), safety (isolation, validation), and clarity (logical organization), structure IaC (e.g., Terraform) as follows:
- Modularize: Break infrastructure into reusable, composable modules (e.g., VPC, EC2, RDS).
- Environment Isolation: Use separate directories/configs for dev/staging/prod, with shared modules.
- Configuration-Driven: Parameterize via variables; avoid hardcoding.
Organize in a monorepo for visibility:
infrastructure/
├── modules/                 # Reusable modules
│   ├── vpc/                 # Generic VPC module
│   │   ├── main.tf
│   │   ├── variables.tf
│   │   └── outputs.tf
│   └── ec2-instance/        # Generic EC2 module
├── environments/            # Environment-specific
│   ├── dev/
│   │   ├── main.tf          # Calls modules with dev vars
│   │   ├── terraform.tfvars # Dev-specific values (e.g., small instance sizes)
│   │   └── backend.tf       # Remote state (dev bucket)
│   ├── staging/
│   │   ├── main.tf
│   │   ├── terraform.tfvars # Staging vars (medium sizes)
│   │   └── backend.tf       # Staging state
│   └── prod/
│       ├── main.tf
│       ├── terraform.tfvars # Prod vars (large sizes, high availability)
│       └── backend.tf       # Prod state
├── global/                  # Shared (e.g., networking)
│   └── main.tf
└── README.md                # Docs on usage, naming conventions
- Variables: Use
terraform.tfvarsfor env-specific overrides (e.g.,instance_type = "t3.micro"in dev vs."m5.4xlarge"in prod). - Remote State: Store state in S3/Consul per env (e.g.,
s3_bucket = "tf-state-${env}") to prevent cross-env drift. - Workspaces: Optional for simple isolation (e.g.,
terraform workspace new dev), but directories preferred for complex setups.
| Goal | Practice | Example (Terraform) |
|---|---|---|
| Reuse | Parameterize modules; version them (e.g., via Git tags). | Module call: module "vpc" { source = "../modules/vpc" cidr = var.vpc_cidr } |
| Safety | Use remote backends, locking (e.g., DynamoDB), and plan/apply gates (e.g., CI/CD approval for prod). Secrets via Vault/AWS SSM. | Backend: backend "s3" { bucket = "tf-state-${terraform.workspace}" } |
| Clarity | Consistent naming (e.g., resource "aws_vpc" "main" {}); inline comments; outputs for cross-module refs. |
Output: output "vpc_id" { value = aws_vpc.main.id } |
This setup allows applying changes per env (cd environments/dev && terraform apply) while sharing 80%+ code, reducing errors and easing audits.
4. What are the main tradeoffs in choosing between blue/green, canary, and rolling deployment strategies? Give real examples.
| Strategy | Key Pros | Key Cons | Best For | Resource Impact |
|---|---|---|---|---|
| Blue/Green | Zero downtime; instant rollback by traffic switch | Double infrastructure cost; complex setup (e.g., DB sync) | High-traffic apps needing reliability | High (2x envs) |
| Canary | Low risk via subset testing; real-user feedback | Slower full rollout; requires advanced monitoring/segmentation | User-facing apps with variable load | Medium (targeted) |
| Rolling | No extra resources; gradual, continuous updates | Partial downtime risk; rollback harder (partial revert) | Stateless, scalable microservices | Low (in-place) |
- Blue/Green: Netflix deploys Chaos Monkey updates to a green env, switches 100% traffic post-testing, enabling zero-downtime for 200M+ users.
- Canary: Etsy rolls new search features to 5% of traffic first, monitors error rates, then expands—catching issues like query slowdowns early.
- Rolling: AWS Elastic Beanstalk updates EC2 fleets by replacing instances in waves, minimizing disruption for backend APIs without idle capacity.
5. How do you decide when to build your own internal tooling (or platform) vs using a managed / third-party tool?
Evaluate based on these key factors, prioritizing time to value, total cost of ownership (TCO), and strategic fit. Use a weighted scorecard (e.g., score 1-5 per factor) to decide.
| Factor | Build Internal If... | Use Managed/Third-Party If... |
|---|---|---|
| Customization | Needs are highly unique/specific (e.g., proprietary workflows). | Standard requirements with minor tweaks suffice. |
| Cost & TCO | Long-term savings via in-house expertise; low vendor lock-in risk. | Faster ROI; predictable pricing; avoids dev/maintenance overhead. |
| Maintenance | Team has bandwidth/skill for ongoing support. | Want zero/minimal upkeep; focus on core business. |
| Scalability/Security | Sensitive data requires full control; custom scaling logic. | Leverages provider's infra/expertise (e.g., compliance, uptime SLAs). |
| Integration/Speed | Deep ties to existing stack; no good off-the-shelf options. | Quick setup; broad ecosystem compatibility. |
- Build Internal: Custom deployment orchestrator for a fintech firm's air-gapped, compliance-heavy pipeline—avoids vendor audits but requires 3-6 months dev time.
- Use Third-Party: Monitoring with Datadog instead of homegrown dashboards—plugs into Kubernetes in days, handles petabyte-scale logs without team ops burden.
- Hybrid: Internal GitOps controller wrapping ArgoCD—core logic in-house for IP protection, but leverages managed storage for cost efficiency.
6. How do you set SLIs, SLOs, and error budgets for a service, especially when starting from scratch?
- SLI (Service Level Indicator): Measurable metric tracking service health (e.g., % requests successful).
- SLO (Service Level Objective): Target threshold for the SLI (e.g., 99.9% success rate).
- Error Budget: Acceptable failure allowance = (100% - SLO). Guides risk tolerance (e.g., 0.1% downtime/month).
- Understand User Needs: Interview stakeholders for critical user journeys (e.g., login, checkout). Prioritize 2-3 key SLIs per service.
- Define SLIs: Choose simple, objective metrics. Use "golden signals": latency, traffic, errors, saturation.
- Set SLOs: Base on business impact—aim conservative (e.g., 99% for new services). Factor in historical data or benchmarks; iterate quarterly.
- Calculate Error Budget: SLO × time period (e.g., 99.9% monthly = ~43 min downtime allowed). Use to balance innovation vs. reliability.
- Monitor & Alert: Implement dashboards (e.g., Prometheus/Grafana). Alert on budget exhaustion to trigger rollbacks.
| Aspect | Example for E-Commerce API |
|---|---|
| SLI | % successful requests (HTTP 2xx); 95th percentile latency < 200ms. |
| SLO | 99.5% requests succeed; latency met for 99% of users monthly. |
| Error Budget | 0.5% failures (~3.6 hrs/month downtime); if exceeded, pause features. |
Start small, measure baseline for 1-2 weeks, then refine based on real data.
- RTO (Recovery Time Objective): Max acceptable downtime (e.g., 4 hours for e-commerce order processing).
- RPO (Recovery Point Objective): Max acceptable data loss (e.g., 15 minutes of transaction logs).
- Align RTO/RPO with business impact analysis (BIA) to prioritize critical systems (e.g., databases, apps).
- Conduct BIA: Identify critical systems, dependencies, and impacts (e.g., revenue loss from downtime).
- Define Objectives: Set RTO/RPO targets based on risk tolerance (e.g., RTO < 1 hour for payment gateways).
- Design Strategies: Choose recovery models (backup, replication, failover).
- Implement & Test: Build infrastructure, document procedures, and run simulations (e.g., quarterly drills).
- Monitor & Update: Use tools like monitoring dashboards; review post-incident.
| Strategy | Description | RTO/RPO Impact | Example |
|---|---|---|---|
| Backups | Periodic data snapshots (e.g., daily full + hourly incremental). | Higher RPO (e.g., 1 hour); moderate RTO (e.g., 2-4 hours restore). | AWS S3 versioning for config files; restore from last backup after ransomware. |
| Replication | Real-time data mirroring (e.g., synchronous across regions). | Low RPO (<5 min); low RTO (<15 min failover). | Database mirroring in Azure SQL; switch to secondary site during flood. |
| High Availability (HA) | Active-active clustering with auto-failover. | Near-zero RTO/RPO. | Kubernetes pods in multi-AZ setup; seamless switch if primary node fails. |
- Use hybrid cloud for geo-redundancy.
- Automate with IaC (e.g., Terraform for DR environments).
- Budget for tools like Veeam or DRaaS providers.
- Example Scenario: For a banking app, target RTO=30 min/RPO=5 min via async replication; test by simulating AWS outage, achieving 95% success in drills.
8. How should secrets (API keys, certificates, credentials) be managed, rotated, and audited across environments?
- Use Dedicated Tools: Centralize in vault-like services (e.g., HashiCorp Vault, AWS Secrets Manager, Azure Key Vault) to encrypt at rest/transit and enforce access controls.
- Avoid Hardcoding: Never commit to Git/repo; inject dynamically via env vars, config maps (Kubernetes), or runtime fetches.
- Environment Separation: Use per-env namespaces (e.g.,
prod-api-keyvs.dev-api-key) with role-based access (RBAC). - Example: In CI/CD (GitHub Actions), pull certs from Vault using OIDC auth:
vault kv get -field=key secret/prod/app.
- Automate & Schedule: Leverage tool-native rotation (e.g., AWS rotates RDS creds automatically) or scripts (Lambda functions) every 30-90 days.
- Zero-Downtime: Generate new secrets, propagate to consumers (e.g., via service discovery), then revoke old ones.
- Dynamic Secrets: Prefer short-lived, on-demand creds (e.g., Vault leases for AWS IAM roles expiring in 1h).
- Example: Rotate API key in Terraform: Use
aws_secretsmanager_secret_versionresource with scheduled Lambda to update and notify apps via SNS.
- Log Everything: Enable audit trails for access (who/when/what) and changes; integrate with SIEM (e.g., Splunk).
- Least Privilege & Reviews: Enforce policies (e.g., Vault ACLs); conduct quarterly audits with tools like OPA for policy-as-code.
- Alerts & Monitoring: Set thresholds for anomalous access (e.g., Prometheus metrics on fetch rates).
- Example: Query AWS CloudTrail logs:
filter { eventName = "GetSecretValue" } | stats count by userIdentity.arnto detect overuse in prod env.
DevOps success emphasizes speed, reliability, and business impact. Use these DORA-inspired metrics to track trends quarterly, aiming for elite performance (e.g., daily deploys, <1% failure rate).
| KPI | Description | Example Target (Elite) | Why It Matters (6–12 Mo View) |
|---|---|---|---|
| Deployment Frequency | How often code is deployed to production. | Multiple deploys/day | Measures agility; track if it scales from weekly to daily, reducing backlog. |
| Lead Time for Changes | Time from commit to production deploy. | <1 hour | Gauges efficiency; aim to halve initial times, spotting bottlenecks in CI/CD. |
| Change Failure Rate | % of deploys causing failures. | <15% | Assesses stability; low rates over months indicate robust testing/automation. |
| Mean Time to Recovery (MTTR) | Time to restore service after failure. | <1 hour | Evaluates resilience; consistent drops show improved observability/incident response. |
| Customer Satisfaction (CSAT/NPS) | User feedback scores post-release. | NPS >50 | Links tech to value; monitor for sustained gains from faster features. |
| Automation Coverage | % of processes (e.g., testing, infra) automated. | >80% | Tracks maturity; rising coverage correlates with reduced toil and errors long-term. |
Tip: Benchmark against baselines, correlate with business outcomes (e.g., revenue velocity), and adjust for your context. Tools like Jira, Datadog, or GitHub Insights help.
10. How do you balance velocity (fast changes) with reliability and stability in a product that is evolving quickly?
In DevOps, balance fast changes (velocity) with stability by embedding automation, risk mitigation, and feedback loops into the development lifecycle. This ensures rapid iterations without compromising uptime.
-
Automate CI/CD Pipelines
Integrate continuous integration/testing and deployment to validate changes early and often.
Example: Use Jenkins or GitHub Actions to run unit/integration tests on every commit, preventing faulty code from reaching production—reducing deployment time from days to minutes while catching 80%+ of bugs pre-merge. -
Leverage Feature Flags and Dark Launches
Deploy code without activating features, allowing quick rollbacks and A/B testing.
Example: At Netflix, flags enable toggling new recommendation algorithms on subsets of users; if issues arise, flip the flag off in seconds without redeploying. -
Adopt Progressive Rollouts (Canary/Blue-Green)
Release changes to small user groups first, then scale if stable.
Example: Google's blue-green setup mirrors production environments; traffic shifts gradually, minimizing downtime during updates—handling millions of daily changes with <0.01% failure rate. -
Implement Robust Monitoring & Observability
Use tools for real-time metrics, logs, and traces to detect anomalies instantly.
Example: With Datadog or Prometheus, set alerts for error spikes; during a rapid API update at Etsy, monitoring enabled a 5-minute rollback, preserving 99.9% uptime. -
Embrace Small, Incremental Changes
Break epics into tiny PRs (e.g., <200 lines) reviewed frequently.
Example: Amazon's "two-pizza teams" deploy micro-changes daily via trunk-based development, fostering velocity while maintaining code quality through peer reviews.
These practices create a "shift-left" culture—designing reliability into velocity from the start. Measure success with DORA metrics (e.g., deployment frequency > daily, change failure rate <15%). Adapt based on your product's scale for optimal results.
11. Describe how you would design a Kubernetes cluster (node groups, autoscaling, namespaces, network policies, etc.) for a multi-tenant environment.
Core Principles: Emphasize isolation (logical/security boundaries), scalability (resource efficiency), and observability (monitoring per tenant). Use a single cluster for cost savings, with strict controls to prevent "noisy neighbor" issues.
- Design: Separate node pools by tenant workload type (e.g., CPU-intensive vs. memory-intensive) or sensitivity (e.g., prod vs. dev). Use managed node groups (e.g., EKS/ASG) with taints/labels for scheduling.
- Isolation: Taint nodes per tenant (e.g.,
tenant=alpha:NoSchedule) and tolerations on tenant pods. - Example:
tenant-alpha-nodes: High-CPU instances for Tenant A.tenant-beta-nodes: GPU-enabled for Tenant B.
- Design: Cluster Autoscaler for node scaling + Horizontal Pod Autoscaler (HPA) for pods. Vertical Pod Autoscaler (VPA) for resource tuning. Set per-tenant limits to avoid over-provisioning.
- Isolation: Use namespace-scoped HPA/VPA; scale node groups independently.
- Example:
- HPA: Scale pods from 3→10 replicas if CPU >70% in
alpha-ns. - Cluster Autoscaler: Add 2 nodes to
alpha-groupif unschedulable pods >1.
- HPA: Scale pods from 3→10 replicas if CPU >70% in
- Design: One namespace per tenant (or per env/tenant combo) for logical separation of resources (pods, services, configs).
- Isolation: Enforce ResourceQuotas/LimitRanges per namespace (e.g., max 10 pods, 4GB memory).
- Example:
ns-alpha-prod: Tenant A's production workloads.ns-beta-dev: Tenant B's development, with quota:{requests.cpu: "2", limits.cpu: "4"}.
- Design: Calico/Cilium for L7 enforcement. Default-deny all ingress/egress, allow only explicit tenant traffic.
- Isolation: Label pods by namespace/tenant; policies block cross-namespace access.
- Example:
apiVersion: networking.k8s.io/v1
kind: NetworkPolicy
metadata:
  name: alpha-allow-internal
  namespace: alpha-ns
spec:
  podSelector: {}
  policyTypes: [Ingress]
  ingress:
  - from:
    - namespaceSelector:
        matchLabels:
          tenant: alpha
- RBAC: Namespace-scoped roles; bind users/services to specific namespaces (e.g.,
RoleBindingfor Tenant A inalpha-ns). - Security: PodSecurityPolicies or Admission Controllers (e.g., OPA Gatekeeper) to enforce tenant-specific policies (e.g., no root containers).
- Monitoring: Prometheus with namespace labels; Grafana dashboards per tenant.
- Secrets: External (Vault) or namespace-isolated (SealedSecrets).
This design balances shared efficiency with strong isolation, scalable via tools like Karpenter for advanced autoscaling. Test with chaos engineering for resilience.
12. How do Kubernetes pods / services communicate internally, and how do you restrict inter-service communication via network policies or service meshes?
Kubernetes pods and services communicate via the cluster's Container Network Interface (CNI) plugin (e.g., Calico, Flannel), enabling flat networking across nodes. Key mechanisms:
- Pod-to-Pod: Direct via pod IP (e.g.,
10.244.1.5:8080). Pods on the same node use localhost/loopback for efficiency. - Service-to-Service: Via stable service DNS (e.g.,
backend-service.default.svc.cluster.local:80) or ClusterIP. Kube-proxy handles load balancing. - Discovery: CoreDNS resolves service names; headless services expose pod IPs directly.
Example: A frontend pod queries curl backend-service:8080 to reach backend pods transparently.
By default, all pods can communicate (no zero-trust by default). Restrict via:
- Declarative YAML rules for ingress/egress traffic, acting as pod-level firewalls.
- Selectors target pods by labels; specify allowed ports/protocols/from pods/namespaces.
- Deny-all default: Apply a policy allowing only explicit traffic.
Example YAML (Allow frontend to access backend on port 8080):
apiVersion: networking.k8s.io/v1
kind: NetworkPolicy
metadata:
  name: backend-access
spec:
  podSelector:
    matchLabels:
      app: backend
  policyTypes:
  - Ingress
  ingress:
  - from:
    - podSelector:
        matchLabels:
          app: frontend
    ports:
    - protocol: TCP
port: 8080- Effect: Blocks all other ingress to backend pods.
- Deploy proxy sidecars (e.g., Envoy) per pod for fine-grained control: mTLS encryption, rate limiting, circuit breaking.
- Central config (e.g., Istio's VirtualServices, AuthorizationPolicies) enforces policies cluster-wide.
- Adds observability (tracing/metrics) beyond restrictions.
Example (Istio: Deny traffic unless mTLS-authenticated):
apiVersion: security.istio.io/v1beta1
kind: PeerAuthentication
metadata:
  name: default
spec:
  mtls:
mode: STRICT # Enforces mutual TLS- Effect: Frontend must present valid cert to reach backend; unauthorized traffic drops.
Trade-offs: Network Policies are lightweight/simple but namespace-scoped; service meshes are powerful/secure but add overhead (latency ~1-5ms). Use policies for basic isolation, meshes for production-scale microservices.
13. What is a service mesh (Istio, Linkerd, etc.) and when would you adopt it? What are its pros/cons?
A service mesh is a configurable infrastructure layer that handles communication between microservices in a distributed system (e.g., Kubernetes). It deploys lightweight proxies (sidecars) alongside each service to manage traffic, security, and observability without altering application code. Popular examples: Istio (feature-rich, Envoy-based), Linkerd (lightweight, Rust-based), Consul (HashiCorp's integrated solution).
Adopt in complex microservices environments (e.g., 50+ services) needing:
- Fine-grained traffic control (e.g., A/B testing, canary releases).
- Zero-trust security (e.g., mTLS encryption).
- Advanced observability (e.g., distributed tracing).
- Resilience patterns (e.g., retries, timeouts).
Avoid for simple monoliths or small apps where native Kubernetes networking suffices.
- Centralized control: Uniform policies for routing, security, and monitoring across services.
- Enhanced security: Automatic mTLS, authorization without app changes.
- Observability: Built-in metrics, logs, traces (integrates with Prometheus, Jaeger).
- Resilience: Circuit breaking, load balancing, fault injection for testing.
- Example: Istio's VirtualService for blue-green deployments reduces downtime by 90%.
- Complexity: Steep learning curve; requires expertise to configure (e.g., Istio's CRDs).
- Overhead: 5-10% CPU/memory increase from sidecars; potential latency spikes.
- Operational burden: Managing proxies adds tooling/debugging needs.
- Vendor lock-in: Tight coupling to ecosystem (e.g., Linkerd's Kubernetes focus).
- Example: In a startup with 5 services, Linkerd's overhead might outweigh benefits vs. basic Ingress.
14. How do you manage storage, stateful workloads, or data consistency in containerized environments?
Containers (e.g., Docker) are ephemeral by default, so state management requires external persistence and orchestration tools like Kubernetes (K8s). Key strategies:
- Use Persistent Volumes (PVs): Decouple storage from pods; bind via PersistentVolumeClaims (PVCs) for dynamic provisioning.
- Example: Mount an AWS EBS volume to a PVC in K8s YAML:
apiVersion: v1
kind: PersistentVolumeClaim
metadata:
  name: my-pvc
spec:
  accessModes: [ReadWriteOnce]
  resources:
    requests:
      storage: 10Gi
- Example: Mount an AWS EBS volume to a PVC in K8s YAML:
- Alternatives: Docker volumes (
docker volume create) or host mounts for dev; cloud-native (e.g., Azure Disk) for prod.
- Deploy with StatefulSets: Ensures stable pod identities, ordered scaling, and sticky storage for apps like databases.
- Example: Run a 3-node MongoDB cluster: StatefulSet creates pods
mongo-0,mongo-1,mongo-2with unique PVCs, headless service for discovery.
- Example: Run a 3-node MongoDB cluster: StatefulSet creates pods
- Operators: Use Helm charts or K8s Operators (e.g., PostgreSQL Operator) for automated scaling/HA.
- Replication & Backups: Sync data across replicas (e.g., etcd for K8s config) with tools like Velero for snapshots.
- Example: In MySQL StatefulSet, enable master-slave replication; use
mysqldumpcronjobs for backups to S3.
- Example: In MySQL StatefulSet, enable master-slave replication; use
- Distributed Strategies: Leader election (e.g., via Raft in Consul) or eventual consistency with CRDTs for NoSQL; ACID transactions via distributed DBs like CockroachDB.
- Monitoring: Prometheus + Grafana to alert on lag; CSI drivers for snapshot consistency.
Best Practice: Start with K8s for orchestration; test failover with Chaos Engineering (e.g., Litmus). Scale via autoscaling + external storage classes.
15. What challenges have you encountered with container image build pipelines (security, caching, layer reuse, size) and how did you solve them?
- Challenge: Base images or packages introduce unpatched CVEs, risking runtime exploits; scanning adds build time overhead.
- Solution: Integrate automated scanners (e.g., Trivy, Snyk) in CI/CD; enforce policy-as-code to block high-severity issues; use signed, minimal base images like distroless.
- Example: In a Python pipeline, added Trivy post-build scan in GitHub Actions—failed deploys if score >7/10, reducing vulns by 80%.
- Challenge: Frequent cache misses during
apt-getornpm installinflate build times from minutes to hours. - Solution: Leverage Docker BuildKit's inline cache mounts; pre-fetch layers in CI; use external registries for shared caches across teams.
- Example: For a Go app, mounted
/go/pkgas a cache volume in Dockerfile, cutting rebuilds from 15min to 2min on CI retries.
- Challenge: Changing a single file (e.g., app code) invalidates all downstream layers, breaking reuse and slowing pipelines.
- Solution: Reorder instructions—static assets/deps first, dynamic code last; use
.dockerignoreto exclude noise; adopt multi-stage for isolated layers. - Example: In a React build, copied
package-lock.jsonbeforesrc/dir, reusing npm layers 90% of the time across PRs.
- Challenge: Images exceed 1GB due to build tools, caches, and debug files, straining registries and deploys.
- Solution: Multi-stage builds to discard build env; clean caches post-install (e.g.,
rm -rf /var/cache/apt); compress with tools like Dive for analysis. - Example: Node.js image shrank from 900MB to 150MB by building in
node:18stage, copying dist/ tonode:18-alpineruntime, and pruning dev deps.
16. Walk me through the design of a robust CI/CD pipeline you’ve built from scratch. What stages, gates, checks, and rollbacks did you include?
I designed a multi-stage CI/CD pipeline using GitHub Actions (or Jenkins equivalent) for a microservices-based web app, emphasizing automation, security, and reliability. It integrates source control (Git), containerization (Docker), orchestration (Kubernetes), and monitoring (Prometheus/Grafana). Below is the high-level walkthrough.
- Source & Build (CI Focus): Trigger on code push/PR to main. Lint code (ESLint), run unit tests (Jest), compile/build artifacts (npm build), and package into Docker images. Output: Tagged image pushed to registry (e.g., ECR).
- Test (Quality Gate): Parallel integration (Cypress E2E), security scans (Snyk for vulns), and performance tests (Artillery load simulation). Gate: Fail if coverage <80% or vulns > critical.
- Deploy to Staging: Blue-green deployment to K8s staging env. Smoke tests post-deploy (curl health checks).
- Approval & Release Gate: Manual approval for prod via Slack notification; auto if non-breaking changes. Semantic versioning via semantic-release.
- Deploy to Production: Canary release (10% traffic initially), then ramp-up based on metrics. Full rollout if stable.
- Automated Gates: Branch protection (require PR reviews, status checks). Pre-merge: Static analysis (SonarQube), dependency audits (Dependabot).
- Security Checks: Secrets scanning (Trivy), IaC validation (Terraform plan checks via Atlantis).
- Compliance Checks: Policy-as-code (OPA/Gatekeeper) enforces env-specific rules (e.g., no prod secrets in staging).
- Observability: All stages log to ELK stack; alerts on failures via PagerDuty.
- Automated Rollback: If post-deploy metrics degrade (e.g., error rate >5% via Datadog), auto-revert to previous stable image using K8s rollback command.
- Manual Fallback: Circuit breakers in Istio for traffic shifting back to blue env in blue-green setup.
- Example: In a past outage, a canary deploy spiked latency—pipeline detected via Prometheus query (
rate(http_requests_total[5m]) > threshold), triggered rollback in <2min, restoring service.
This pipeline reduced deploy time from hours to ~15min, with 99.9% uptime. Adaptable to tools like GitLab CI or ArgoCD for flux-based GitOps.
17. How do you implement automated testing (unit, integration, end-to-end) and enforce test quality in a pipeline?
Automated testing ensures code quality by running tests at key pipeline stages (e.g., build, deploy). Use tools like Jenkins, GitHub Actions, or GitLab CI to orchestrate. Tests run in parallel for speed, with failures halting the pipeline.
- Implementation: Write tests using frameworks like JUnit (Java), pytest (Python), or Jest (JS). Trigger via pipeline script on code push/PR.
- Pipeline Integration: Add stage after build (e.g.,
npm testormvn test). - Example: In GitHub Actions YAML:
- name: Run Unit Tests
  run: npm test -- --coverage
- Implementation: Use tools like Testcontainers (Dockerized DBs) or Spring Boot Test (Java). Mock external services.
- Pipeline Integration: Dedicated stage post-unit, using ephemeral environments (e.g., spin up DB via Docker).
- Example: Jenkins stage:
stage('Integration') {
    steps { sh 'docker-compose up -d; pytest integration_tests.py' }
}
- Implementation: Tools like Cypress, Selenium, or Playwright. Target UI/API in a staging env.
- Pipeline Integration: Final pre-prod stage; use cloud browsers (e.g., Sauce Labs) for cross-device testing.
- Example: GitLab CI job:
e2e_tests:
  script: cypress run --spec "cypress/e2e/user-flow.cy.js"
  environment: staging
- Coverage Gates: Require >80% coverage (e.g., via SonarQube or Codecov); fail build if unmet.
- Quality Checks: Lint tests (e.g., ESLint), enforce naming conventions, and scan for flakiness (retry logic).
- Reporting & Monitoring: Generate HTML reports (e.g., Allure); integrate with Slack/Teams for alerts. Track metrics like pass rate in dashboards.
- Example Gate: In CircleCI:
- run: |
    if [ $(codecov --token=$CODECOV_TOKEN --file=coverage/lcov.info | grep -o 'Lines.*%') < 80 ]; then exit 1; fi
This setup catches issues early, reduces MTTR, and scales with microservices. Adapt thresholds/tools to team needs.
18. How do you handle database schema migrations in a continuous deployment environment, especially when migrations may fail or need rollbacks?
In continuous deployment, treat schema changes as code: version them, automate execution, and ensure safety via testing and reversibility. Use tools like Flyway, Liquibase, or Alembic for declarative/incremental migrations.
- Version Control: Store migrations as SQL files in Git (e.g.,
V1__add_users_table.sql). Tag releases to track applied changes. - Automation in Pipeline:
- Run migrations post-deploy via CI/CD (e.g., Jenkins/GitHub Actions) on app startup or dedicated job.
- Apply only pending migrations; tools track state in a metadata table (e.g.,
flyway_schema_history).
- Failure Handling:
- Make migrations idempotent (safe to rerun) and atomic (single transaction).
- Test in staging with smoke tests (e.g., query validation).
- Monitor via alerts (e.g., Prometheus) on migration errors.
- Rollback Strategies:
- Reversible Migrations: Write forward + backward scripts (e.g., Liquibase
<rollback>tags). - Blue-Green/Canary: Deploy to subset; rollback by switching traffic if migration fails.
- Time-Based: Use feature flags to toggle new schema usage; revert code without DB undo.
- Reversible Migrations: Write forward + backward scripts (e.g., Liquibase
- Flyway Failure: If
V2__alter_column.sqlfails mid-deploy, pipeline aborts, reverts app version; manual rollback viaflyway undo. - Liquibase Rollback: For a failed add-index migration, execute
<rollback> DROP INDEX idx_users_email; </rollback>in a dedicated rollback stage. - Zero-Downtime: In Kubernetes, use init containers for migrations; if it fails, pod restarts without affecting prod traffic.
This minimizes downtime (<1min) and risk in high-velocity environments.
19. How do you version deployments and releases (e.g. semantic versioning, tags, branching) in a multi-service codebase?
In multi-service (e.g., microservices) setups, treat each service independently for versioning while coordinating cross-service releases via CI/CD pipelines. Use a monorepo for shared tooling or polyrepo for isolation. Key practices:
- Format:
MAJOR.MINOR.PATCH(e.g.,1.2.3) per service, incremented based on API changes:- MAJOR: Breaking changes (e.g., v2.0.0 for auth service API overhaul).
- MINOR: Backward-compatible features (e.g., v1.1.0 for new endpoint).
- PATCH: Bug fixes (e.g., v1.0.1 for security patch).
- Example: In a monorepo, tag service dirs like
services/auth/v1.2.3. Automate with tools likesemantic-releaseto bump versions on merge.
- Trunk-Based Development (recommended for speed): Short-lived feature branches (
feature/user-auth) merge tomainfrequently; no long-liveddevelop.- Pros: Reduces merge conflicts in multi-service teams.
- GitFlow (for complex releases):
main(production),develop(integration),release/v1.2(staging prep), hotfix branches.- Example: Branch per service (
auth/release/v1.2), merge to shareddevelopfor e2e testing.
- Example: Branch per service (
- Coordinate: Use PRs with required approvals; block merges if dependent services lag.
- Tag releases on
mainafter successful CI builds:git tag -a v1.2.3 -m "Release notes".- Lightweight:
git tag v1.2.3. - Annotated: Includes metadata for traceability.
- Lightweight:
- Multi-Service Release: Orchestrate via tools like ArgoCD or Jenkins; e.g., deploy all services at
v1.2.xin lockstep, or canary-roll individual services. - Example Workflow:
- Merge feature to
main→ CI tests → Auto-tagv1.2.3. - CD pipeline deploys tagged artifacts to Kubernetes namespaces (e.g.,
prod-auth-v1.2.3). - Rollback: Pin to previous tag if issues arise.
- Merge feature to
- Changelogs: Auto-generate with
conventional-changelog. - Coordination: Use release trains (e.g., bi-weekly) for inter-service compatibility.
- Tools: GitHub Actions/Terraform for tagging; Helm charts for service-specific versioning.
This ensures traceability, rollback safety, and minimal downtime in distributed systems.
20. How do you integrate security (DevSecOps) into the CI/CD pipeline (e.g. scanning, vulnerability checks, artifact signing)?
DevSecOps embeds security throughout the CI/CD lifecycle ("shift left") via automated checks, gates, and policies. Use tools like GitHub Actions, Jenkins, or GitLab CI to orchestrate. Key stages and examples:
- Purpose: Detect vulnerabilities early in source code and libraries.
- Implementation: Run static application security testing (SAST) and software composition analysis (SCA) as pipeline gates; fail builds on high-severity issues.
- Examples:
- SonarQube/Snyk: Scan for code smells, secrets, and deps in PRs (e.g.,
snyk testin GitHub Actions YAML). - OWASP Dependency-Check: Integrates via Maven/Gradle plugins to flag CVEs.
- SonarQube/Snyk: Scan for code smells, secrets, and deps in PRs (e.g.,
- Purpose: Validate runtime artifacts (e.g., containers, binaries) for exploits.
- Implementation: Automate dynamic analysis (DAST) and infrastructure-as-code (IaC) scans; enforce thresholds (e.g., no critical vulns).
- Examples:
- Trivy/Aqua Security: Scan Docker images for OS/package vulns (e.g.,
trivy image myapp:latestin CI job). - Checkov/Terraform Security: Lint IaC files for misconfigs during test stage.
- Trivy/Aqua Security: Scan Docker images for OS/package vulns (e.g.,
- Purpose: Ensure integrity, authenticity, and traceability of deployed artifacts.
- Implementation: Sign with keys/certificates; verify in downstream stages; integrate with SBOM generation for audit trails.
- Examples:
- Cosign/Sigstore: Sign OCI images (e.g.,
cosign sign --key cosign.key myrepo/imagein release job; verify on pull). - Notary/SignPath: For binaries; chain with policy-as-code (e.g., OPA/Gatekeeper) to block unsigned deploys.
- Cosign/Sigstore: Sign OCI images (e.g.,
- Automation & Monitoring: Use OR gates (pass on low-risk) and dashboards (e.g., Prometheus + Grafana) for visibility.
- Benefits: Reduces breach risk by 50-70% (per industry benchmarks); scales via policy engines like Kyverno.
- Tip: Start small—pilot one stage (e.g., dep scanning) before full rollout.
21. Describe your approach to observability: logs, metrics, tracing. How do you choose what to instrument?
Observability enables understanding system behavior through data collection and analysis, using the three pillars: logs (events), metrics (quantitative measures), and tracing (request flows). I adopt a "golden signals" framework (latency, traffic, errors, saturation) to guide implementation, integrating tools like Prometheus (metrics), ELK Stack (logs), and Jaeger (tracing) in cloud-native environments (e.g., Kubernetes).
- Purpose: Capture unstructured/textual events for root-cause analysis.
- Implementation: Structured logging (JSON) with severity levels; rotate/aggregate to avoid noise.
- Example: In a microservice, log API request/response details with timestamps and user IDs for auditing failed auth attempts.
- Purpose: Track performance trends and alerts via time-series data.
- Implementation: Collect counters, gauges, histograms; set SLOs (e.g., 99.9% uptime).
- Example: Monitor pod CPU/memory usage in K8s; alert on >80% saturation to prevent outages.
- Purpose: Visualize end-to-end latency in polyglot systems.
- Implementation: Use OpenTelemetry for instrumentation; sample high-volume traces.
- Example: Trace a user checkout flow across services (frontend → payment → inventory) to pinpoint bottlenecks in DB queries.
Prioritize based on impact, complexity, and cost:
- High-Impact First: Critical paths (e.g., user-facing APIs) via ABC analysis (80/20 rule).
- Business Alignment: Tie to SLOs/KPIs (e.g., instrument error-prone payment gateways).
- Iterative: Start minimal (e.g., entry/exit spans), expand via feedback from incidents; avoid over-instrumentation by sampling (e.g., 1% of traces).
- Example Decision: Instrument tracing only for slow endpoints (>500ms) to balance observability with overhead.
- Observability: Tools like metrics, logs, and traces (e.g., Prometheus, ELK Stack, Jaeger) to monitor and debug systems in real-time.
- MTTR: Average time to detect, diagnose, and recover from failures; reduced by faster root-cause identification.
Scenario: During Black Friday, a retail app's checkout service fails under load, causing cart abandonment.
-
Without Observability:
- Detection: 45 min (user complaints via support tickets).
- Diagnosis: 90 min (manual log sifting across 5 microservices).
- Recovery: 30 min (code rollback).
- Total MTTR: ~2.5 hours; lost ~$500K revenue.
-
With Improved Observability (Added distributed tracing + alerting):
- Detection: 2 min (auto-alert on error rate spike).
- Diagnosis: 5 min (trace reveals DB query bottleneck in payment gateway).
- Recovery: 8 min (scale DB replicas via auto-script).
- Total MTTR: 15 min; revenue loss < $50K (90% reduction).
Impact: 10x faster recovery via pinpointing issues, enabling proactive scaling.
Scenario: Kubernetes pod crash in a SaaS platform post-update.
- Pre-Observability: MTTR ~4 hours (SSH into nodes, grep logs).
- Post-Observability (Grafana dashboards + OpenTelemetry): MTTR drops to 20 min (visual correlation of metrics/logs shows config error in ingress controller).
- Result: Uptime improves from 99.2% to 99.9%; team focuses on features, not firefighting.
23. Walk me through how you respond to a high-severity production outage. What are your steps from detection to resolution to postmortem?
As a DevOps engineer, I follow a structured incident response process (e.g., ITIL-inspired) to minimize downtime, ensure clear communication, and prevent recurrence. Here's the step-by-step walkthrough:
- Action: Monitor alerts via tools like PagerDuty, Datadog, or Prometheus. Triage based on severity (e.g., P0: full outage affecting >50% users).
- Immediate: Acknowledge alert, notify on-call team via Slack/Teams, and declare incident in a war room (e.g., Zoom bridge).
- Example: Alert fires for 99% error rate on API endpoint; I page the team and start logging in incident tracker (Jira).
- Action: Assess impact (e.g., query logs/metrics for affected services/users). Contain by rollback/failover if safe.
- Immediate: Escalate to stakeholders (e.g., execs via email); assign roles (e.g., lead investigator, comms lead).
- Example: For a database outage, failover to secondary replica in AWS RDS to restore 80% availability within 10 min.
- Action: Reproduce issue in staging if possible; root cause analysis (RCA) using 5 Whys or fishbone diagram. Collaborate via shared docs (e.g., Confluence).
- Immediate: Update status every 15 min; monitor SLIs (e.g., uptime <99.9% triggers SLA breach).
- Example: Trace Kubernetes pod crashes to a bad Helm deployment; inspect via
kubectl logsand Grafana dashboards.
- Action: Deploy fix (e.g., patch, config change) via CI/CD pipelines with approvals. Verify via canary testing.
- Immediate: Communicate ETA and post-resolution checks (e.g., load tests).
- Example: Hotfix a memory leak by updating container image; roll out progressively across AZs, confirming via New Relic.
- Action: Blameless retrospective meeting; document timeline, RCA, actions (e.g., Jira tickets for automation gaps). Share lessons learned company-wide.
- Immediate: Update runbooks; track MTTR (mean time to resolution) for trends.
- Example: After a config drift outage, add GitOps enforcement with ArgoCD; reduce future MTTR from 2 hrs to 45 min.
This process ensures accountability, learning, and resilience—aiming for <1 hr MTTR on P0 incidents.
24. How do you avoid alert fatigue? How do you design alerts so they’re actionable and meaningful rather than noise?
Alert Fatigue Overview: Alert fatigue occurs when teams are overwhelmed by excessive, irrelevant notifications, leading to ignored critical issues. Mitigation focuses on reducing volume and ensuring relevance.
- Prioritize & Reduce Volume: Set thresholds for high-impact metrics only; use aggregation (e.g., alert once per hour on recurring issues).
- Integrate Context: Correlate alerts across systems (e.g., via SLOs) to provide "why" behind the alert.
- Automate Triage: Implement auto-remediation for low-severity issues and suppress during maintenance windows.
- Review & Tune Regularly: Conduct post-incident reviews to refine rules; aim for <5% false positives.
Use the RICE framework (Relevance, Impact, Clarity, Escalation) for alert rules:
- Relevance: Alert on user-impacting symptoms, not root causes (e.g., error rate >5% vs. disk space >80%).
- Impact: Tie to business SLOs (e.g., alert if latency exceeds 99th percentile target).
- Clarity: Include actionable details (e.g., "Deploy rollback script" link).
- Escalation: Define severity tiers with on-call handoffs.
| Alert Type | Poor Design (Noise) | Better Design (Actionable) |
|---|---|---|
| CPU Usage | Alert on >70% every 5min | Alert on >90% for 10min sustained, with query to kill top process |
| Error Rate | Alert on any 4xx error | Alert if >2% over 5min, grouped by endpoint, with logs snippet |
| Downtime | Alert on any pod restart | Alert if >3 restarts/min in cluster, with auto-scale suggestion |
Examples in Practice:
- Netflix's Approach: Uses "chaos engineering" to test alerts, ensuring only chaos-induced failures trigger them meaningfully.
- PagerDuty Integration: Routes alerts to specific teams based on tags (e.g., #db-team for query slowdowns), cutting noise by 40%.
- Grafana Dashboards: Embed alerts with drill-down visuals, turning "high load" into "scale up replicas via Terraform module."
Result: Teams focus on resolution, not sifting—target <10 alerts/shift for on-call.
25. How would you debug a performance issue that spans multiple services, databases, and network layers (i.e. you don’t know the root cause at first)?
When facing a performance bottleneck across services, databases, and networks (e.g., slow API responses in a microservices app), follow a systematic, observability-driven approach to pinpoint the root cause without initial assumptions.
- Capture symptoms: Measure end-to-end latency (e.g., via user reports or load tests with JMeter).
- Define scope: Identify affected users/endpoints (e.g., high traffic spikes at 2 PM daily).
- Example: Use Kibana to query logs for "response_time > 5s" during peak hours.
- Collect data: Deploy monitoring (Prometheus/Grafana for metrics, ELK for logs).
- Correlate signals: Look for anomalies like CPU spikes or error rates.
- Example: In Datadog, overlay service metrics (e.g., pod CPU at 90%) with DB query times to spot correlations.
- Trace requests: Use tools like Jaeger/Zipkin to visualize spans across layers.
- Identify hotspots: Pinpoint slow segments (e.g., 80% of latency in DB queries).
- Example: A trace reveals 200ms network hop between Service A and Redis—drill into inter-service calls.
- Test components: Bypass layers (e.g., mock DB with in-memory store) or run synthetic tests.
- Profile deeply: Use flame graphs (e.g., via Pyflame for Python services) or EXPLAIN on SQL queries.
- Example: Slow Kafka consumer? Profile with
straceto detect I/O waits; network issue? Usemtrto trace packet loss to upstream DB.
- Test fixes: Deploy canary releases and monitor deltas.
- Document: Update runbooks for recurrence.
- Example: Hypothesis of index-missing DB query validated by adding index, reducing latency 70%.
This iterative method (often 1-4 hours initially) minimizes downtime; prioritize tools integrated into your stack for speed.
