-
It is a term project for the year 3 module, Business Analytics. We needed to find any problem that can be solved by data mining techniques in one of business domains.
-
Topic : Prediction of integration and abolition for university.
-
Goal : To predict departments that might be integrated or abolished using competition rate for each department of schools.
- A trend of decreasing the school-age population and the number of students eligible for admission.
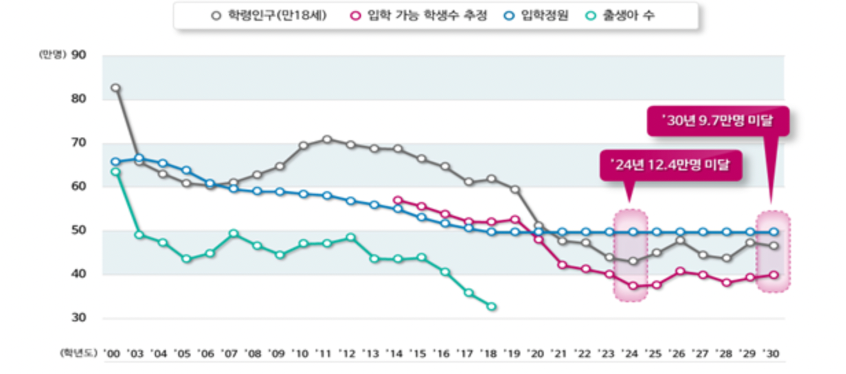
- Trends in integration and abolition of university departments is increasing in South Korea.
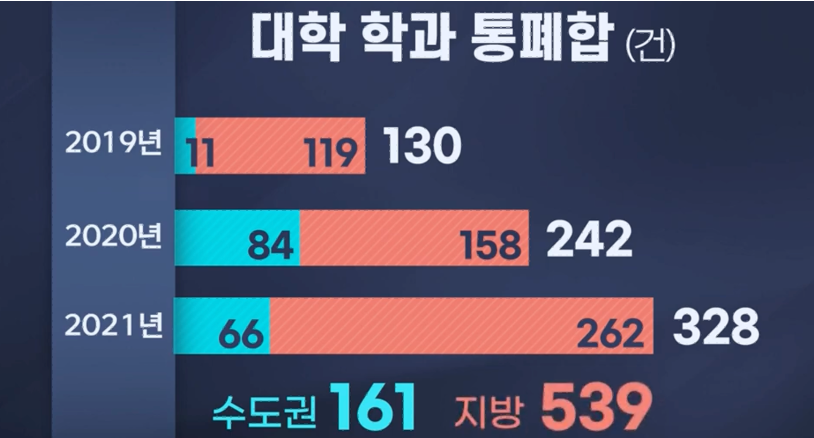
As the number of students decreased, the restructuring of universities was also being carried out intensively.
- Expected Effect
- For Student : The predictions can be considered when selecting a university to go.
- For University : With the predictions, universities can know the position of themselves and prepare for changing phenomenons.
2. Dataset
- This dataset has 3 columns, Year, University, and Gov_Sponsorship.
- Our team manually collected separate dataset from Korea Development Institute and editted into one file.
- Year : The year of evaluation
- University : The name of university
- Gov_Sponsorship
- 1 : Government sponsorship
- 0 : No government sponsorship
- Year : Year information for each admission
- Region : Region information for each school
- Departmental Affiliation : A major classification of departmental affiliations
- The number to be admitted : Information on students admitted by departments
- Candidate : The number of candidates
- The number of admissions : Information on students who admitted
- Government financial support
- 1 : Existence of government financial support
- 0 : No existence of government financial support
- School & Department : Information merged on school and each department
- Competition rate : Information derived from dividing the number of applicants by the number to be admitted
- Total fertility rate : Information on fertility rate by each region
- Net mover : Information on net mover by each region
- Immigration : Information on the number of immigration
- File Name : future.csv
- The number to be admitted : Information on students admitted by departments
- Candidate : The number of candidates
- Government financial support
- 1 : Existence of government financial support
- 0 : No existence of government financial support
- Awareness : Information on awareness of departmental affiliations to students
- Total fertility rate : Information on fertility rate by each region
- Net mover : Information on net mover by each region
- Immigration : Information on the number of immigration
- Schoolage : Information on schoolage population by each year
'Schoolage' column : dataset in statistics Korea
'The number to be admitted', 'Government financial support', 'Awareness' column : maintain 2021 data to find the change of competition rate in same condition
'Total fertility rate', 'Net mover', 'Immigration' : Calculate average of difference between 2 years with last 3 years data and subtract from last data
-
File Name : future features 2022/2023/2024/2025/2026.ipynb
- Total fertility rate
fertility_rate_dif = (float(fertility_rate_2019['Total_fertility_rate']) - float(fertility_rate_2020['Total_fertility_rate'])) + (float(fertility_rate_2020['Total_fertility_rate']) - float(fertility_rate_2021['Total_fertility_rate']))
avg_ft.append(fertility_rate_dif / 2)
- Net mover
net_mover_dif = (float(net_mover_2019['Net_Mover']) - float(net_mover_2020['Net_Mover'])) + (float(net_mover_2020['Net_Mover']) - float(net_mover_2021['Net_Mover']))
avg_net.append(net_mover_dif / 2)
- Immigration
immigration_dif = (float(immigration_2019['immigration']) - float(immigration_2020['immigration'])) + (float(immigration_2020['immigration']) - float(immigration_2021['immigration']))
avg_imm.append(immigration_dif / 2)
3717 * 7(years) = 26019 Instances
- Year : Year information for each admission
- Region : Region information for each school
- Departmental Affiliation (major series) : A major classification of departmental affiliations
- Departmental Affiliation (middle series) : A middle classification of departmental affiliations
- The number to be admitted : Information on students admitted by departments
- Candidate : The number of candidates
- The number of admissions : Information on students who admitted
- Government financial support
- 1 : Existence of government financial support
- 0 : No existence of government financial support
- Awareness : Information on awareness of departmental affiliations to students by each year
- School & Department : Information merged on school and each department
- Competition rate : Information derived from dividing the number of applicants by the number to be admitted
- Total fertility rate : Information on fertility rate by each region
- Net mover : Information on net mover by each region
- Immigration : Information on the number of immigration
- Schoolage : Information on schoolage population by each year
-
File Name : future features 2022.ipynb
- only using intersection data
b = a_2015.intersection(a_2016)
b = b.intersection(a_2017)
b = b.intersection(a_2018)
b = b.intersection(a_2019)
b = b.intersection(a_2020)
b = b.intersection(a_2021)
bl = list(b)

main_check = main.loc[main['학교_학과명'].isin(bl)]
- handling duplicated data
main_2015 = main_2015.drop_duplicates(['학교_학과명'], keep='first')
main_2016 = main_2016.drop_duplicates(['학교_학과명'], keep='first')
main_2017 = main_2017.drop_duplicates(['학교_학과명'], keep='first')
main_2018 = main_2018.drop_duplicates(['학교_학과명'], keep='first')
main_2019 = main_2019.drop_duplicates(['학교_학과명'], keep='first')
main_2020 = main_2020.drop_duplicates(['학교_학과명'], keep='first')
main_2021 = main_2021.drop_duplicates(['학교_학과명'], keep='first')
- Model training and predicting result
- File Name : main_training.ipynb
- Independent variables(X) : '연도','시도','대계열','중계열','모집인원_학부계','Gov_Spnsorship','awareness','Total_fertility_rate','Net_Mover','immigration','schoolage'
- Target variable(y) : '지원자_전체_계'
- Model Selection : GridSearchCV(KFold when n_splits is 5) and train_test_split(Train, Test, and Validation)
- Preprocessing with ColumnTransformer
- Numeric features : '모집인원_학부_계','Total_fertility_rate','Net_Mover','immigration','schoolage'
- We used polynomialfeatures with degree 2 and standardscaler.
- Categorical features : '연도','시도','대계열','중계열','Gov_Spnsorship','awareness'
- We used onehotencoder.
- Numeric features : '모집인원_학부_계','Total_fertility_rate','Net_Mover','immigration','schoolage'
- Pipeline combining preprocessor
- When fit is LinearRegression
- r2 score : 0.622863334546101
- When fit is LassoRegression
- r2 score : 0.6232647986187436
- When fit is RidgeRegression
- r2 score : 0.6228460532502517
- When fit is GradientBoostingRegressor
- r2 score : 0.6961511258186199
- When fit is RandomForestRegressor
- r2 score : 0.6447984110664
- When fit is SupportVectorRegression
- r2 score : 0.6116517939646415
- When fit is KernelRidgeRegression
- r2 score : 0.6363528761071908
- When fit is LinearRegression
- Conclusion from model training
- GradientBoostingRegressor performed the best on our dataset with hyperparameters {'fit__loss': 'ls', 'fit__max_depth': 7, 'fit__max_features': 'sqrt', 'fit__min_samples_split': 6}
- Applying on test dataset
- r2 score : 0.9192784570251001
- Predicting future admission
- File Name : main_training.ipynb
- Phase
- Importing future dataset for future independent variables.
- Applying the best model and hyperparameters we obtained from previous step.
- A type of target variable['지원자_전체_계'] was changed into integer because it is counting the number of human.
- We could obtain 'competition_rate' rate, which is our final goal, dividing '지원자_전체_계' into '모집인원_학부_계'
- Extracted the data into excel for visualization.

The larger the size of the circle on the map, the higher the mean. You can check the area and figures according to the color on the right side of the map.

Additional analysis of Jeju with the lowest average competitiveness and Incheon with the highest average competitiveness
We analyzed Incheon with the highest average and Incheon with the lowest average in detail. While 65% of all universities in Jeju Island belong to the bottom 20% group, there were no universities belonging to the group in Incheon. Also, 74.2% of universities in Incheon are in the top 40% group. We think that the geographical disadvantage of Jeju has resulted in this.

The departments on this list are in danger of being eliminated due to lack of competitiveness. In particular, in the case of Gyeongju University's_special physical education department, the risk of disappearing is very high, so it is recommended not to enter.