During the cherry blossom season, the Brooklyn Botanic Garden updates their website daily with a map of their cherry blossom garden. This map shows what stage each tree in the garden is at (Prebloom, First Bloom, Peak Bloom, and Post-Peak Bloom). I really wanted to go see the cherry blossom trees at the perfect time, but kept forgetting to check their website every day for updates. They do not have an alert system set up for letting users know via email or text whether the map has been updated. So, I decided to build my own alert system. I wanted to receive a text whenever the map had updated.
Update (2024): for this year, I wanted less alerts (sometimes the map would update multiple times per day), so I only run the action once a day in the morning.
Uses Github Actions to:
- Scrape the BBG's cherry watch tracker for their data on the current state of the cherry blossom garden
- Using Jest image snapshots, takes a screenshot of the cherry blossom map, and determines if the image has changed from the prior snapshot
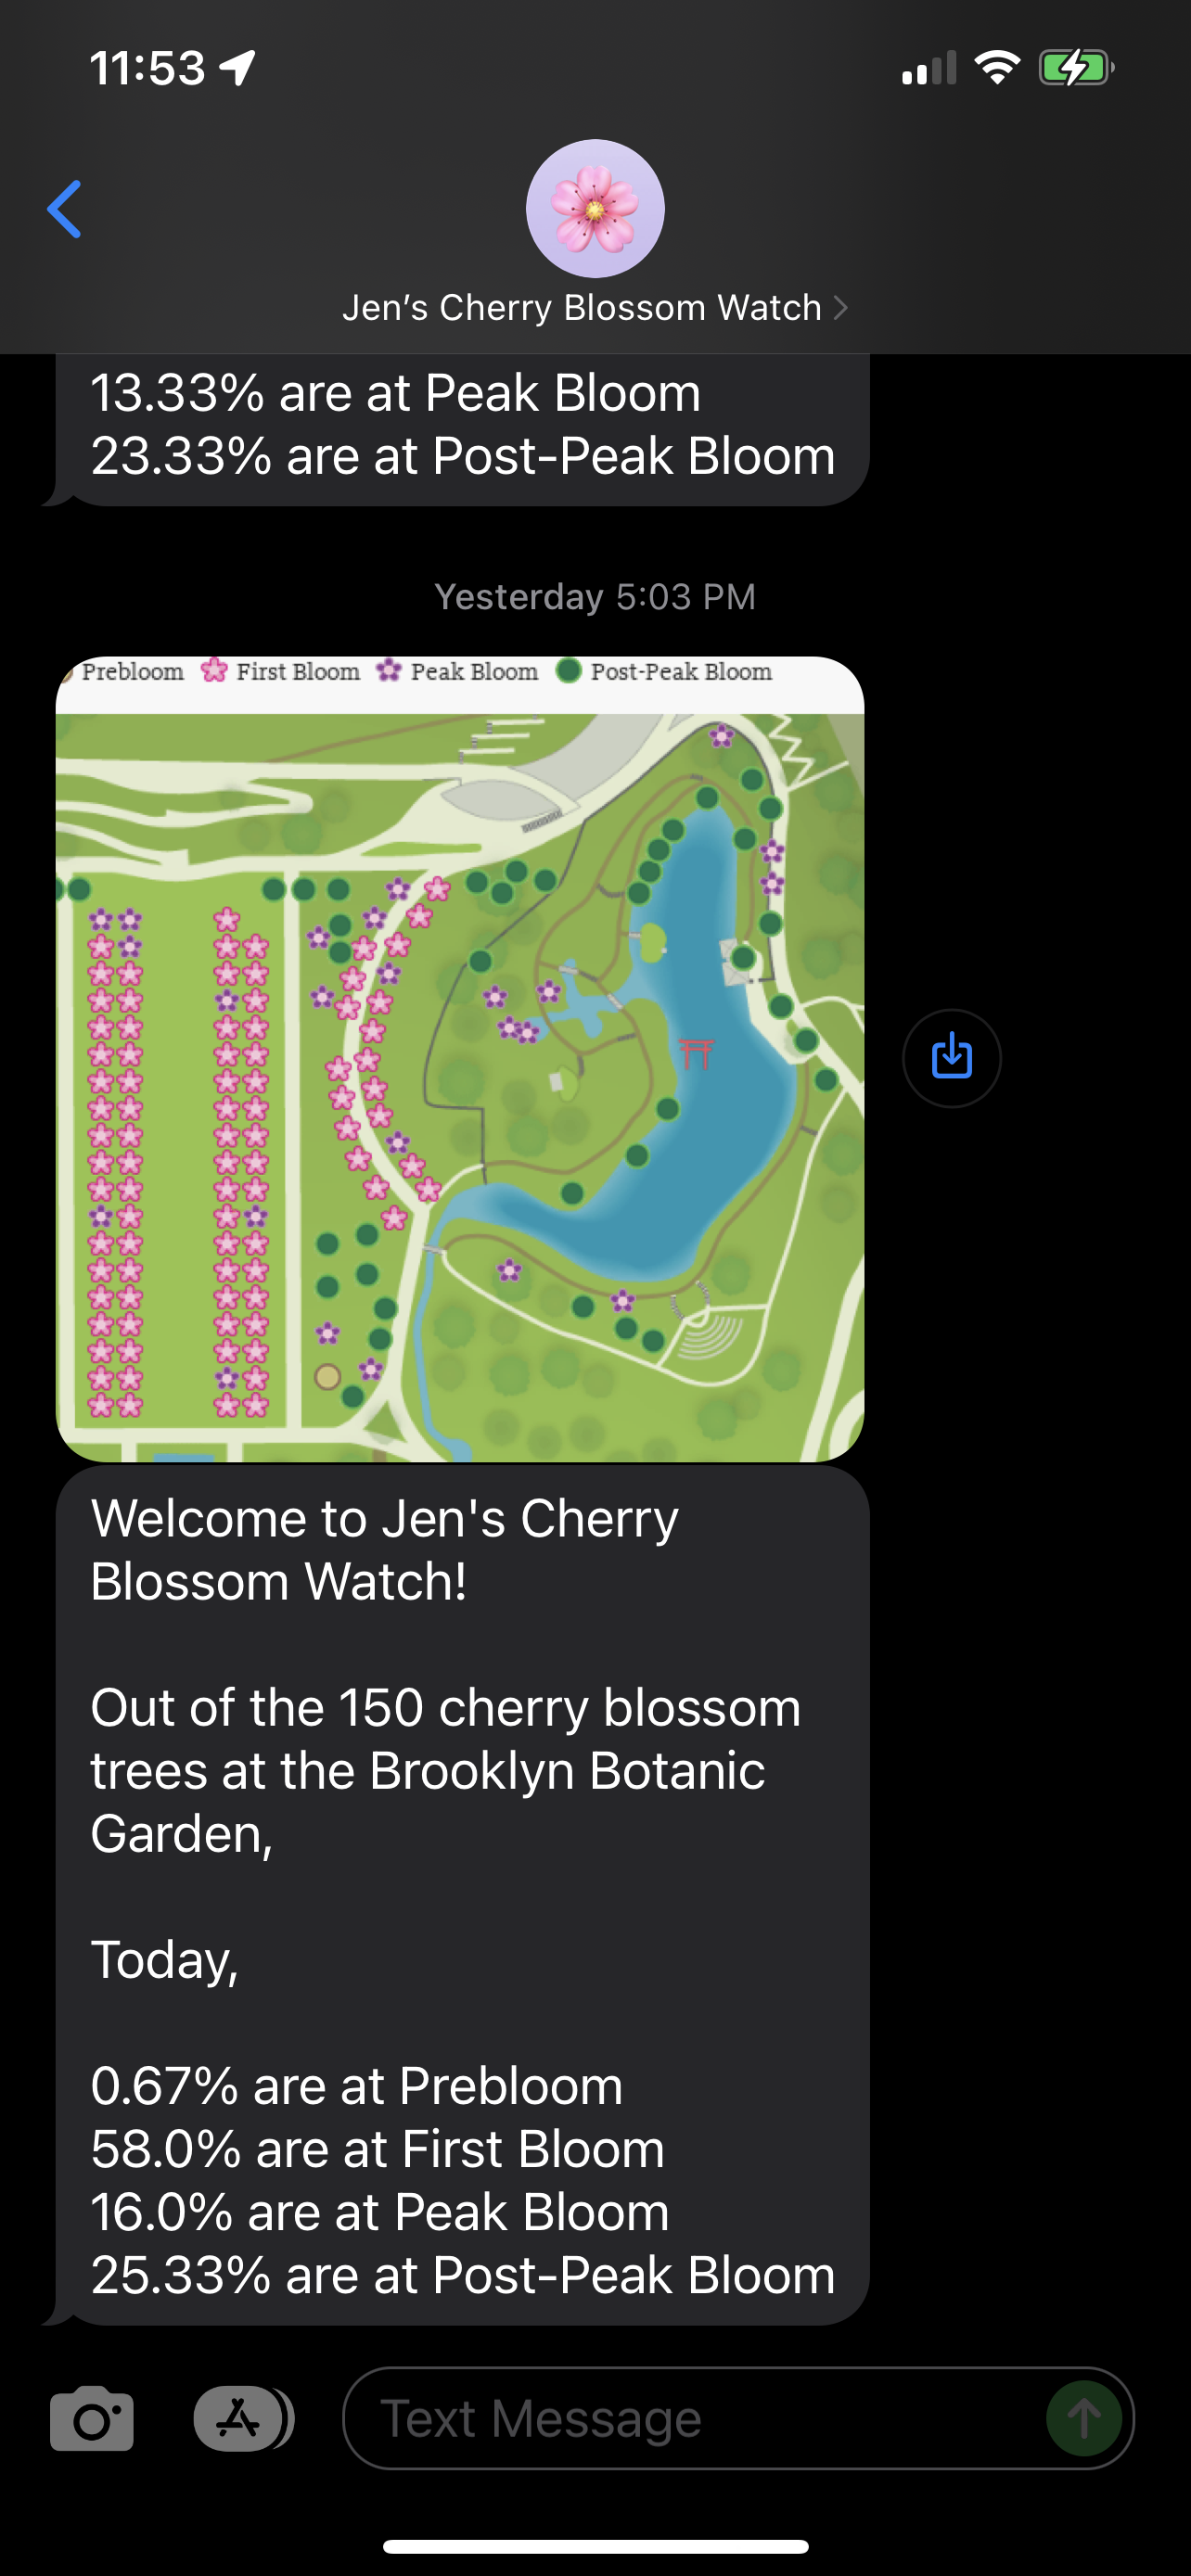
- If the image has changed (the map on their site has been updated), we alert recipients via Twilio of the updates to the garden with stats on each bloom phase and an image of the updated map.
Update (2024):


After some investigation, I found the relevant area of the code that held the cherry blossom data (what bloom stage each tree is at). While I could have used this data to determine if the site had been updated by storing it and comparing it to the previous state on each run, I wanted to test out Jest Image Snapshots (and using Jest regression testing means I don't need to have a database!). Therefore, this system only relies on visual regression testing to determine if the map has been updated.
Update (2024): For this year, instead of just giving an overall percentage of the number of trees in each bloom phase like I had done the previous two years, I realized that the Japanese garden's trees typically bloom much earlier than the main strip of Kanzan trees. Because of this, I'm experimenting with only sending the tree types that are 80% or more in Peak Bloom so you can see what trees are actually in full bloom at any point in time (and you have the map data, so you can also visually see where they are at the garden). I also added the BBG link to the tree types' images so you can see exactly what that type of tree looks like at each bloom stage!
yarn test
yarn test -u
cd docker && docker-compose up --build
cd docker && docker-compose up