
OBT (One Big Table) and 5 queries which are real-world and produce useful insights to showcase SQL Skills.
This project analyzes historical sales data of various Microsoft Operating Systems across different regions, years, and sales channels.
The dataset resides in an Azure SQL Database and is queried using SQL Server Management Studio / Azure Data Studio.
This image validates the existence and deployment of the clouddnova SQL Server and the win_sales SQL Database within the Azure portal. ✅ See screenshot: CloudNova Server.jpg
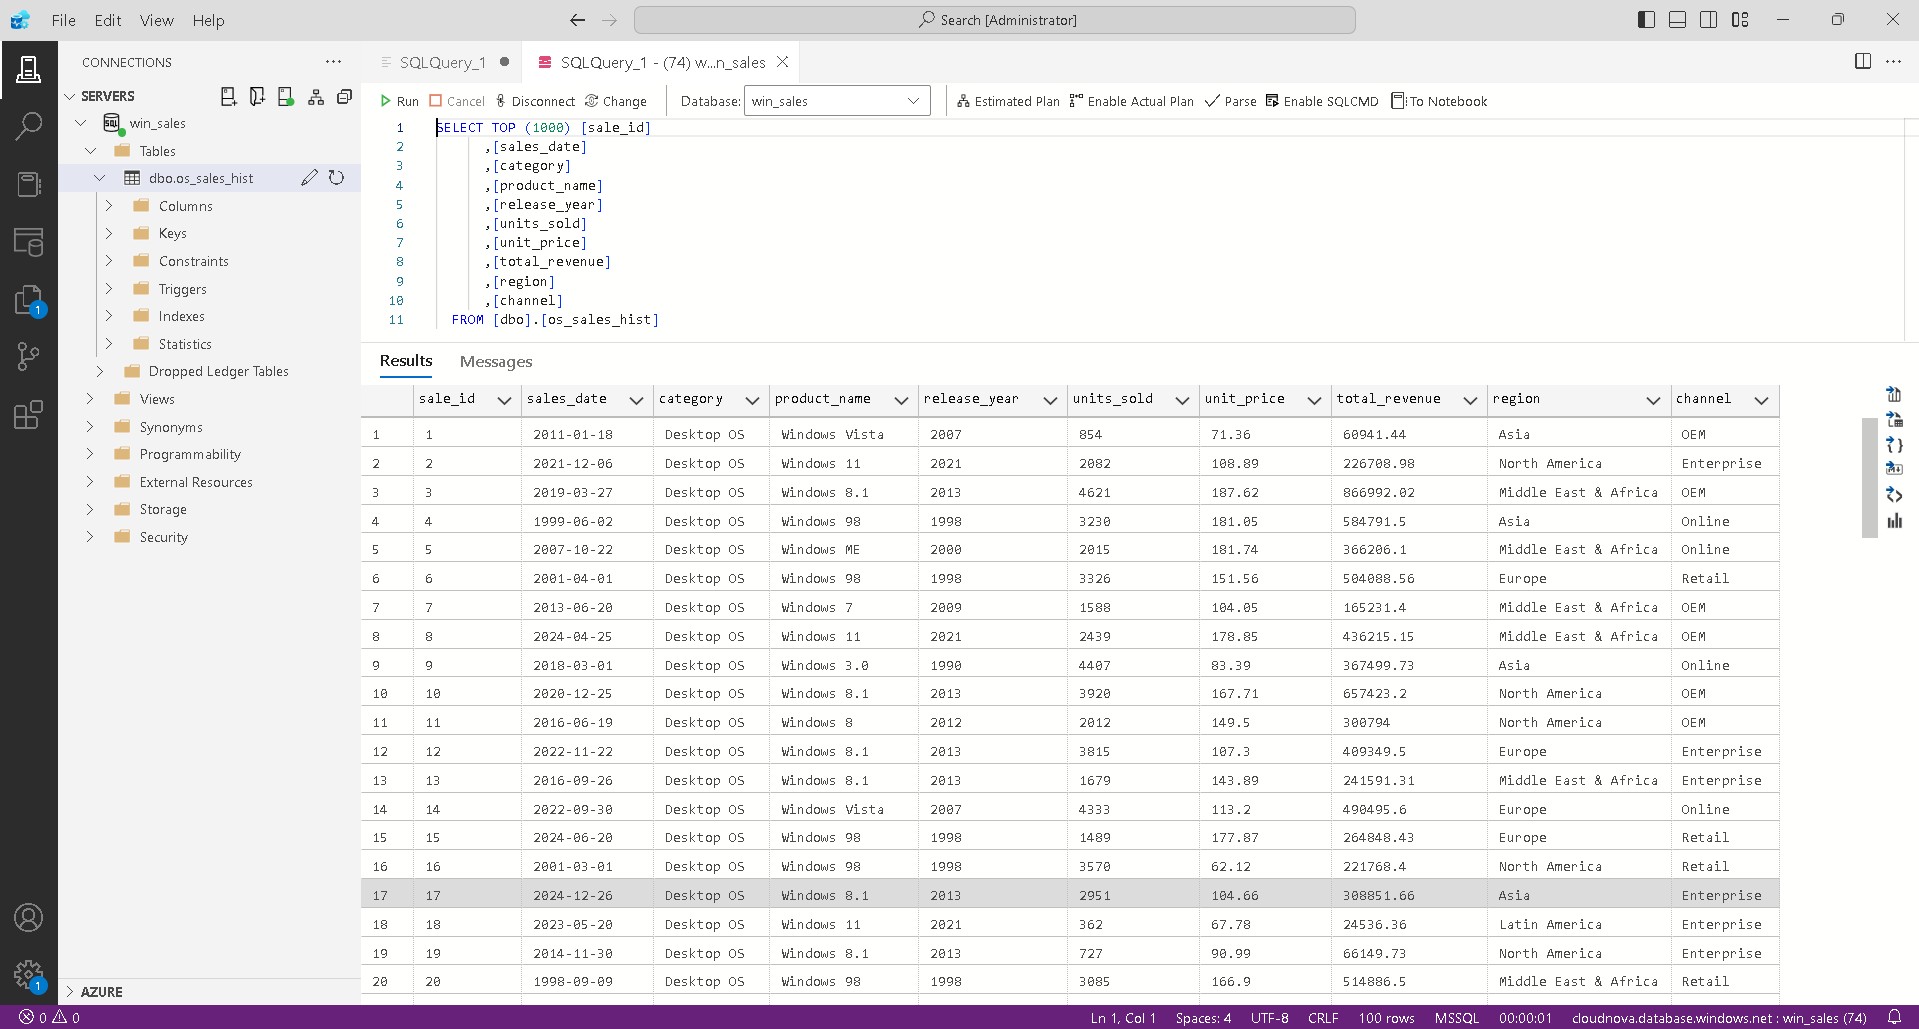
sale_id(int)sales_date(date)category(varchar)product_name(varchar)release_year(int)units_sold(int)unit_price(float)total_revenue(float)region(varchar)channel(varchar)
Purpose: Retrieve a quick look at the raw data to verify structure and completeness.
   SELECT TOP (1000) *
   FROM dbo.os_sales_hist;
✅ See screenshot: query1_os_sales_hist_select_all.jpg
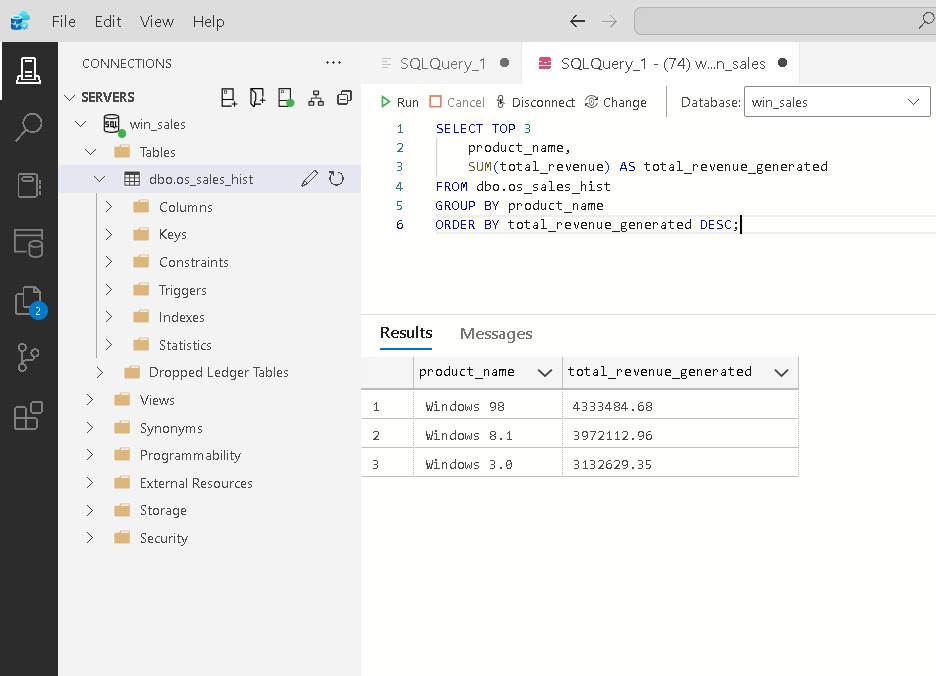
Question: Which operating systems generated the highest total revenue?
   SELECT TOP 3
       product_name,
       SUM(total_revenue) AS total_revenue_generated
   FROM dbo.os_sales_hist
   GROUP BY product_name
   ORDER BY total_revenue_generated DESC;
✅ See screenshot: query2_top_os_revenue.jpg
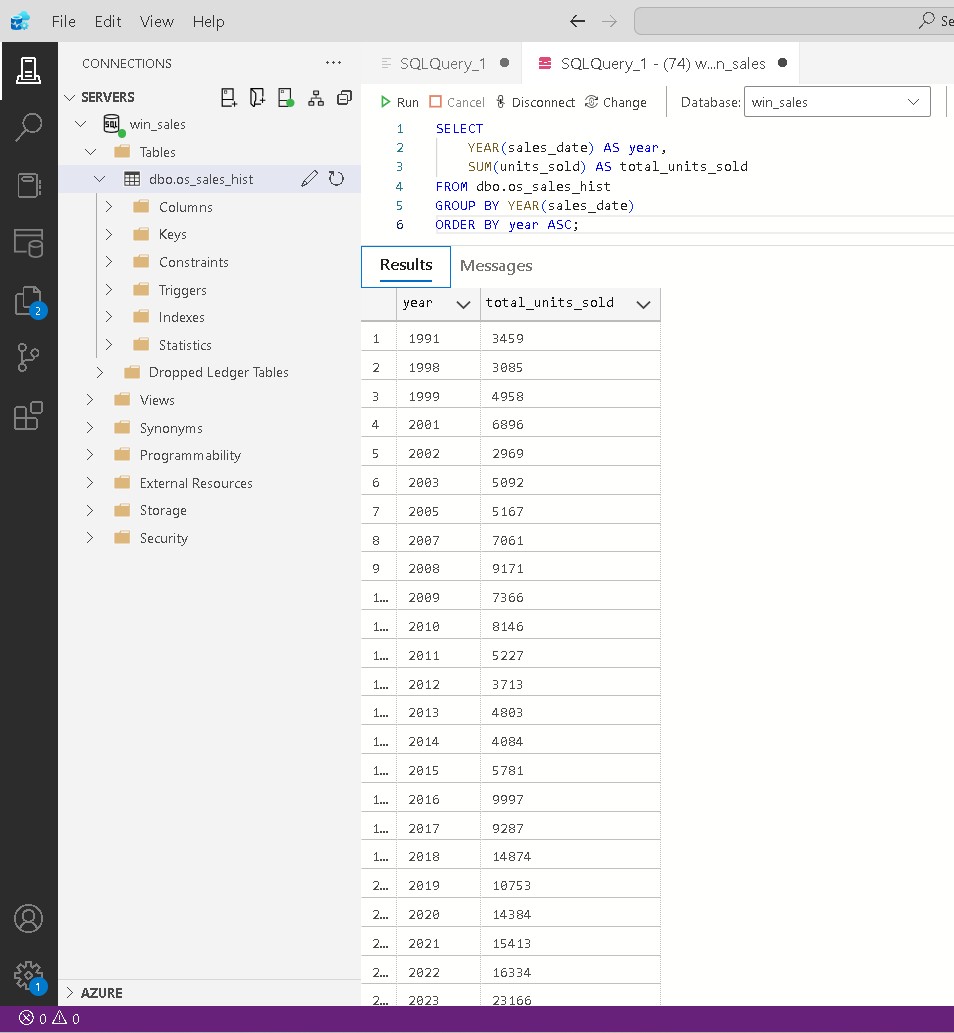
Question: What are the total units sold each year?
   SELECT
       YEAR(sales_date) AS year,
       SUM(units_sold) AS total_units_sold
   FROM dbo.os_sales_hist
   GROUP BY YEAR(sales_date)
   ORDER BY year ASC;
✅ See screenshot: query3_yoy_units_sold.jpg
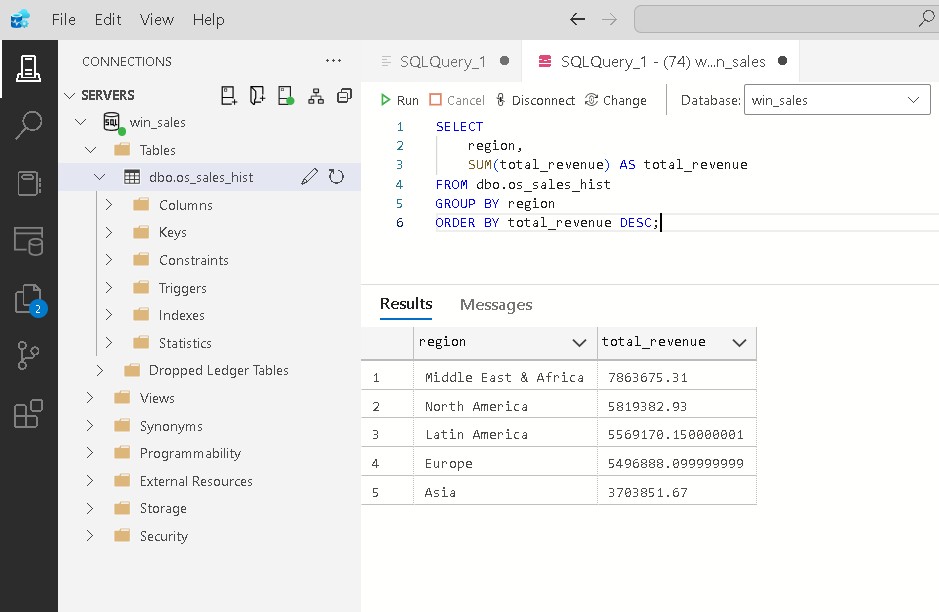
Question: What is the total revenue by sales region?
   SELECT
     region,
     SUM(total_revenue) AS total_revenue
   FROM dbo.os_sales_hist
   GROUP BY region
   ORDER BY total_revenue DESC;
✅ See screenshot: query4_region_revenue.jpg
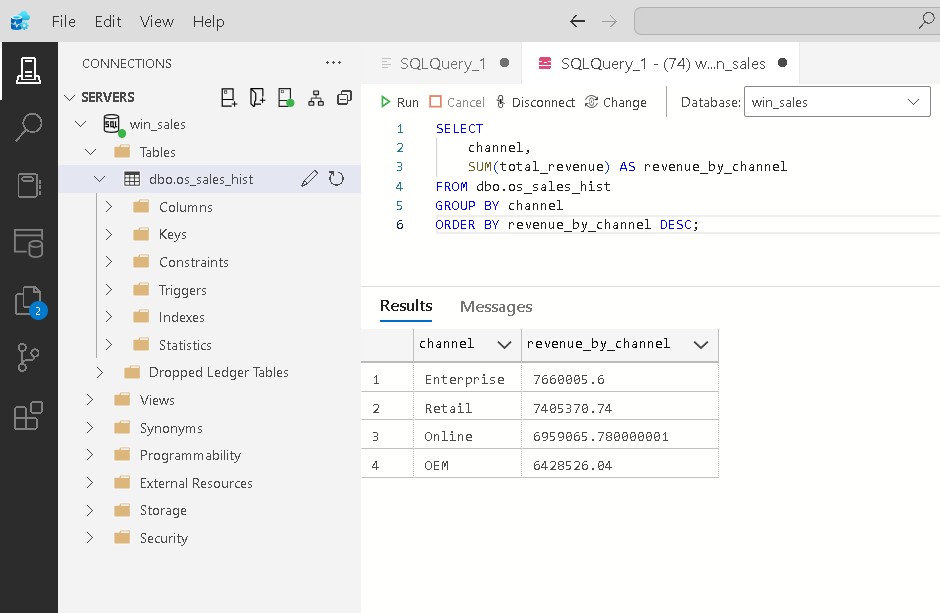
Question: Which distribution channel generated the most revenue?
   SELECT
       channel,
       SUM(total_revenue) AS revenue_by_channel
   FROM dbo.os_sales_hist
   GROUP BY channel
   ORDER BY revenue_by_channel DESC;
✅ See screenshot: query5_channel_profitability.jpg
Microsoft Azure Portal
Azure SQL Database
Azure Data Studio
GitHub for version control and portfolio
Each query result is backed with a screenshot for validation.
Azure portal screenshots show the database and server setup.
SQL Query Writing (Aggregation, Grouping, Ordering)
Real-world data analysis
Azure SQL Database interaction
Azure Data Studio navigation