Calculate gene scores for each gene to determine strength of relationships between other loci genes and then visualize the top genes with corresponding edges, loci, gene score.
Input is two tab-delimited files named 'Input.gmt' and 'STRING.txt'. Input.gmt is a tab-delimited file formatted as Broad Institute’s Gene Matrix Transformed (GMT). STRING.txt is a version of the STRING database of known and predicted protein-protein interactions. Each line in the string file represents an edge in the network between the protein genes formatted protein'\t'protein'\t'weight'\n' where weight is the strength of their functional similarity.
Gene scores are calculated for each gene specified in the input file. Gene scores represent the relative connectedness each gene has to other genes in different loci. These scores are calculated by the number of edges a gene adds to a randomly generated prix fixe subnetwork and averaged for all subnetworks. A prix fixe subnetwork is a network with one gene from each loci.
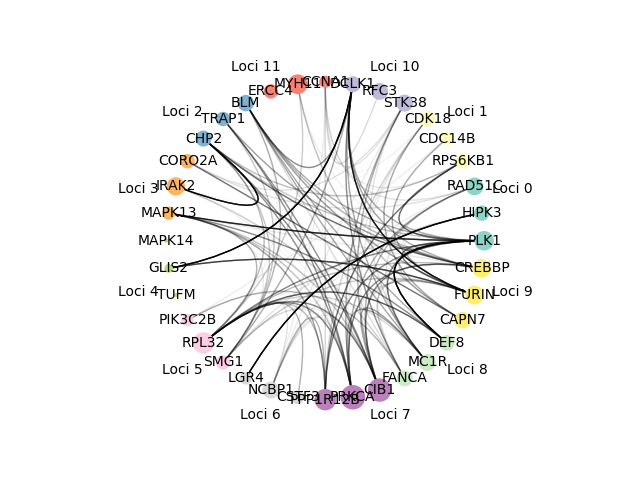
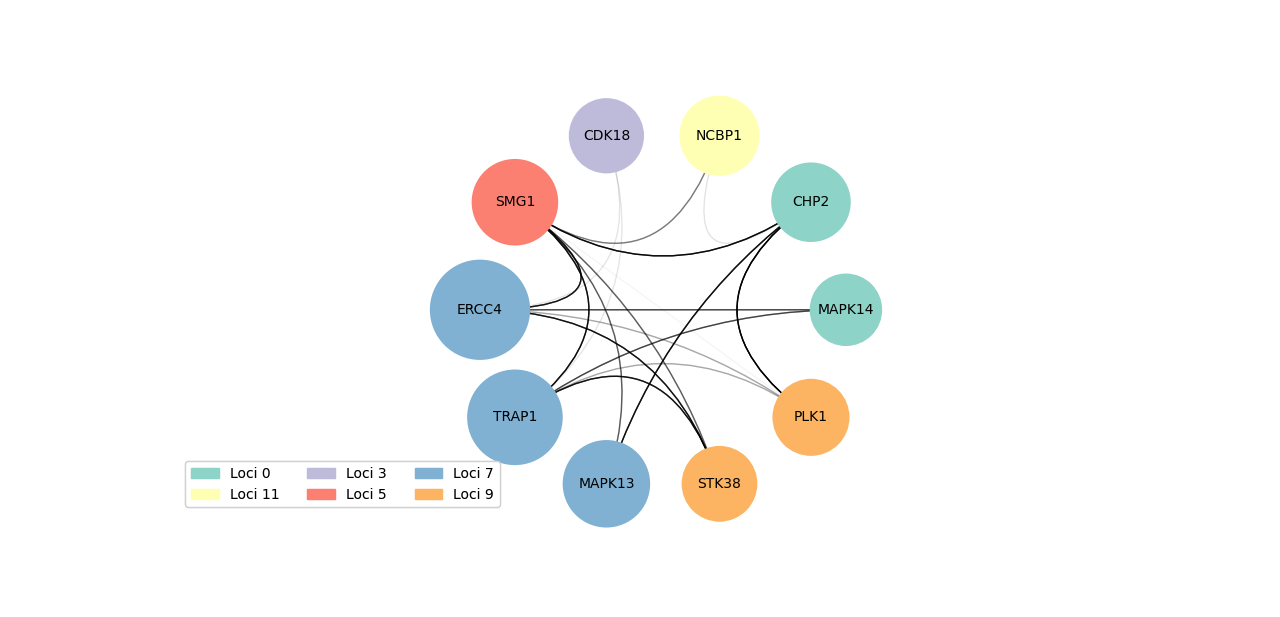
Networks can be visualized to show either the n genes with the highest gene scores or the n genes with the highest scores regardless of loci. They are visualized such that color represents loci of gene, size represents the gene score (bigger node means higher score), edges are from the STRING database with the darkness corresponding to the weight of the edge. The corresponding gene names, loci, gene scores from the visualized network are the output to a specified file.
- scipy
- matplotlib.pyplot
- operator
- functools
- networkx
- nxviz
import networkCreation, fileParsing, networkVisualization, geneScoring

inputF = 'input.gmt.txt'
stringF = 'STRING.txt'

topOverallGenes = False

# read in networks
lociLists = fileParsing.readInput(inputF)
interactions = fileParsing.makeInteractionNetwork(stringF)
network = fileParsing.makeNetwork(lociLists, interactions)

# make loci subnetworks
# make loci subnetworks
lociSubN = networkCreation.makeLociSubnetworks(5000, network, lociLists)

# calculate gene scores and sort genes by score
geneScores = geneScoring.getGeneScores(lociSubN, lociLists, network)
geneAvg = geneScoring.getGeneScoreAvg(geneScores)
networkSorted = sorted(geneAvg, key=lambda k: geneAvg[k], reverse=True)

# get top numGenes from each loci
# make network with genes
if not topOverallGenes:
    genes = geneScoring.getTopLociGenes(geneAvg, lociLists, 3)
    visualNetwork = networkVisualization.makeCrossLociNetwork(genes, network, lociLists)

# get top numGenes regardless of loci
# make network with genes
if topOverallGenes:
    genes = networkSorted[:10]
    visualNetwork = networkVisualization.makeCrossLociNetwork(genes, network, lociLists)

# write to output file the genes loci and gene score of genes in the network
networkVisualization.outputGeneScores(geneAvg, genes, 'topGeneScores.txt', lociLists)
# make graph with specified genes
# 1. gene score - size of node
# 2. loci of gene - color of node
# 3. weight of edge - darkness of edge
# make network between loci genes no edges between genes in same loci
graph = networkVisualization.makeGraph(visualNetwork, lociLists, geneAvg)
networkVisualization.visualizeGraph(graph, 3)$ python main.py yourInputFile.gmt.txt
$ python main.py input.gmt.txt --topGenes=True --numGenes=10
$ python main.py input.gmt.txt --numGenes=3
| Gene | Loci | Gene Score |
|---|---|---|
| PLK1 | 0 | 0.495 |
| LGR4 | 1 | 0.299 |
| RAD51C | 2 | 0.3502 |
| NCBP1 | 3 | 0.4428 |
| FANCA | 4 | 0.101 |
| CDK18 | 5 | 0.5862 |
| IRAK2 | 6 | 0.3686 |
| MAPK14 | 7 | 0.7866 |
| DCLK1 | 8 | 0.3726 |
| ERCC4 | 9 | 0.4646 |
| CIB1 | 10 | 0.3766 |
| TRAP1 | 11 | 0.5038 |
| Gene | Loci | Gene Score |
|---|---|---|
| MAPK14 | 7 | 0.7866 |
| MAPK13 | 7 | 0.7146 |
| STK38 | 7 | 0.5986 |
| CDK18 | 5 | 0.5862 |
| TRAP1 | 11 | 0.5038 |
| PLK1 | 0 | 0.495 |
| ERCC4 | 9 | 0.4646 |
| SMG1 | 9 | 0.4488 |
| NCBP1 | 3 | 0.4428 |
| CHP2 | 0 | 0.4108 |
- Input.gmt
- disjoint gene sets
- tab-delimited file Input.gmt
- First two columns describe row of gene set
- format: (https://software.broadinstitute.org/cancer/software/gsea/wiki/index.php/Data_formats/)
- STRING.txt
- STRING database of known and predicted protein-protein interactions
- tab-delimited
- each line represents an edge in network between two genes
- weighted by strength of functional similarity
- Graph network visualization
- Colors correspond to gene loci
- Edge darkness corresponds to edge weight from STRING database
- Node size corresponds to gene score
- Tab Delimited File of genes, loci and corresponding gene scores
- gives the top genes from each loci or top genes regardless of loci