![]()
This repository is still under active development. Documentation is incomplete and breaking changes may occur.
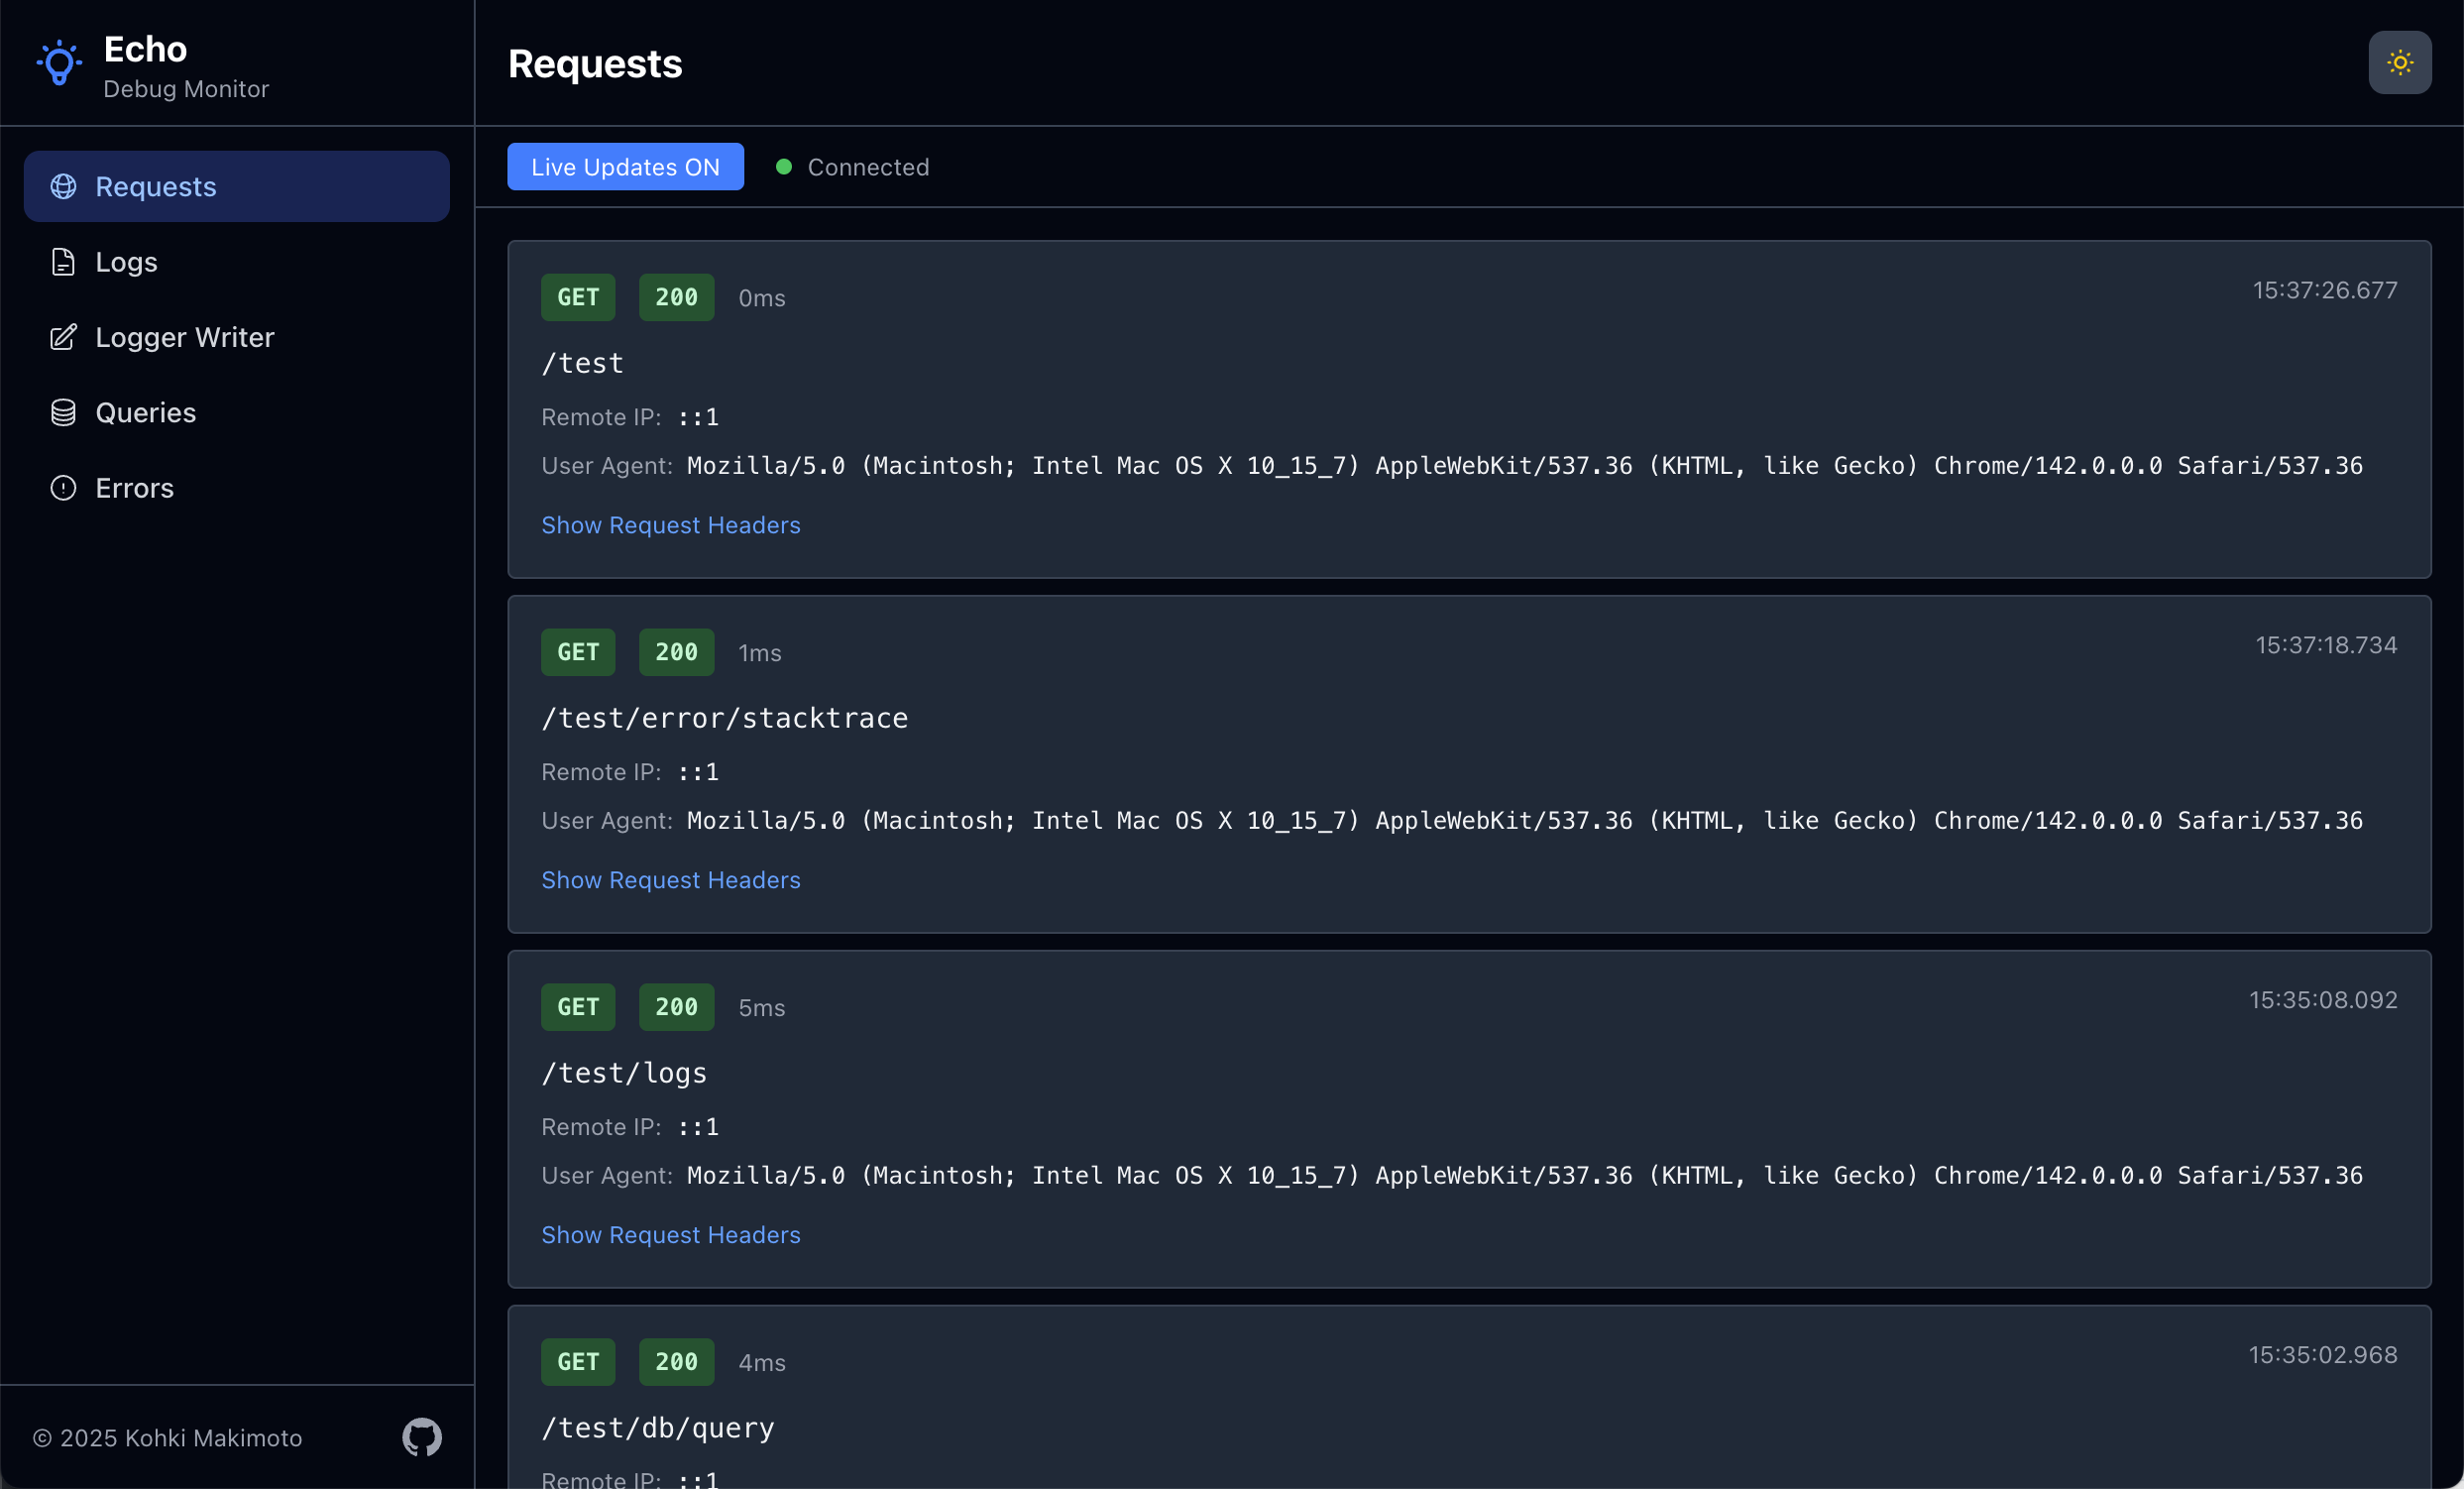
A debugging and monitoring dashboard for Go applications using the Echo web framework. Provides real-time visibility into application behavior through multiple specialized monitors.
Warning
This tool is intended for debugging and development purposes only. Do not activate it in production environments as it may expose sensitive information and impact performance.
go get github.com/kohkimakimoto/echo-debugmonitorHere's a simple example to get started with Echo Debug Monitor:
package main

import (
    "github.com/labstack/echo/v4"
    debugmonitor "github.com/kohkimakimoto/echo-debugmonitor"
    "github.com/kohkimakimoto/echo-debugmonitor/monitors"
)

func main() {
    e := echo.New()

    // Create the debug monitor manager
    m := debugmonitor.New()

    // Add requests monitor
    requestsMonitor, requestsMonitorMiddleware := monitors.NewRequestsMonitor(&monitors.RequestsMonitorConfig{
        Skipper: func(c echo.Context) bool {
            return c.Path() == "/monitor" // Skip monitoring the monitor endpoint itself
        },
    })
    e.Use(requestsMonitorMiddleware)
    m.AddMonitor(requestsMonitor)

    // Add logs monitor
    logsMonitor, wrappedLogger := monitors.NewLogsMonitor(monitors.LogsMonitorConfig{
        Logger: e.Logger,
    })
    e.Logger = wrappedLogger
    m.AddMonitor(logsMonitor)

    // Register the dashboard route
    e.GET("/monitor", m.Handler())

    // Your application routes
    e.GET("/", func(c echo.Context) error {
        e.Logger.Info("Home page accessed")
        return c.String(200, "Hello, World!")
    })

    e.Start(":8080")
}
Then access the monitoring dashboard at http://localhost:8080/monitor.
Monitors are the core units in Echo Debug Monitor. Each monitor tracks a specific aspect of your application and displays it in the dashboard.
A monitor is an independent component that:
- Captures specific types of data (requests, logs, errors, etc.)
- Stores captured data in an in-memory buffer.
- Provides a real-time view in the web interface
Each monitor operates independently and can be added or removed. You can also implement custom monitors for your specific needs.
Echo Debug Monitor includes several ready-to-use monitors in the github.com/kohkimakimoto/echo-debugmonitor/monitors package:
- Requests Monitor: Tracks incoming HTTP requests, response statuses, latencies, etc.
- Logs Monitor: Captures application logs and displays them in real-time.
- Writer Monitor: Monitors output written to
io.Writerinterfaces. - Errors Monitor: Records application errors and stack traces.
- Queries Monitor: Tracks database queries.
WIP
The MIT License (MIT)
Kohki Makimoto [email protected]