A minimal terminal-based monitor that checks TCP ports for configured services and displays their status and last-seen timestamps. State changes are logged in Markdown and trigger desktop notifications.
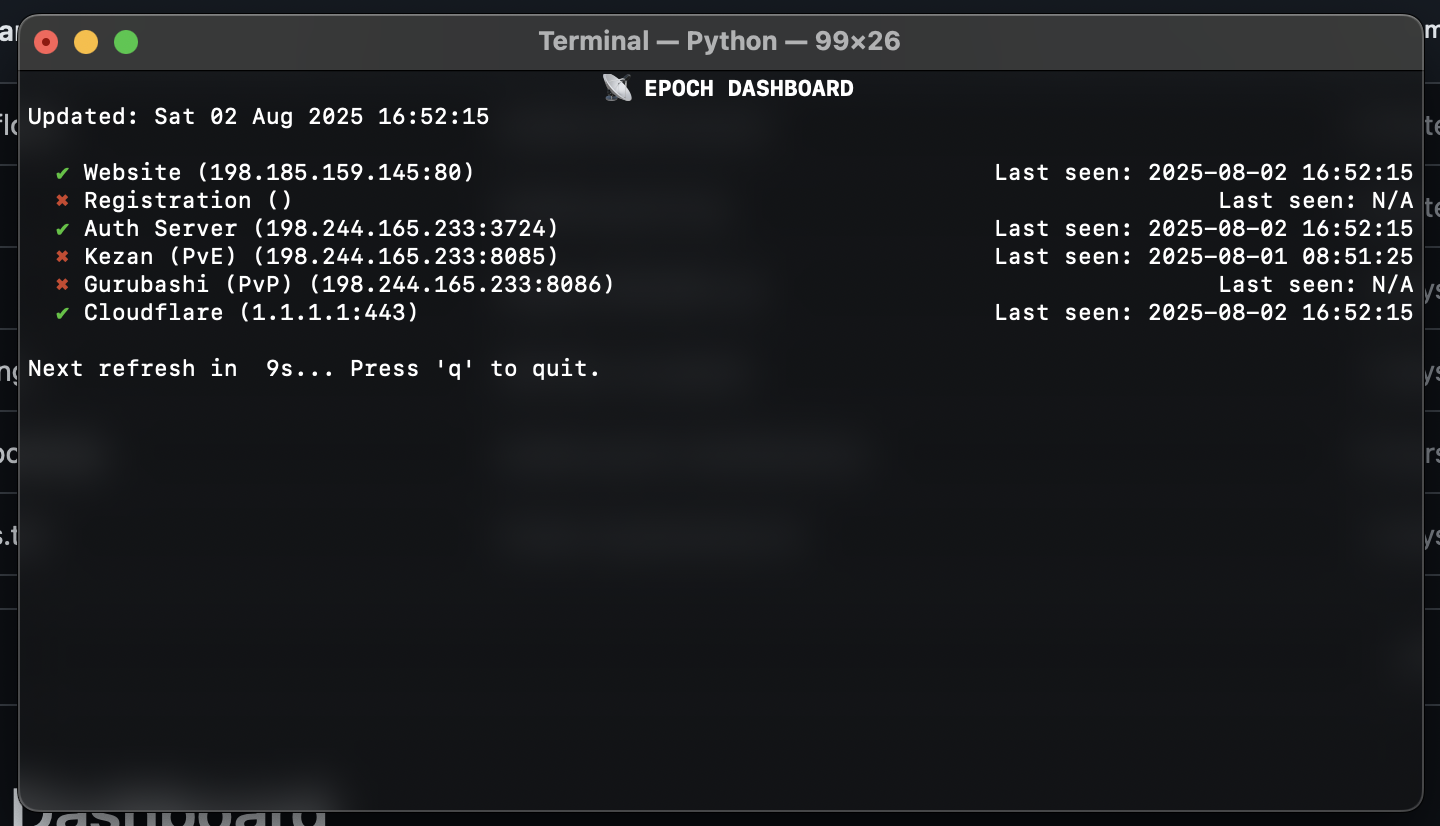
- Periodic port availability checks
- In-place updates of status and last seen time
- Desktop notifications on state changes (macOS, Linux, Windows)
- Markdown log of all state changes
- Python 3.6+
- Windows only:
pip install windows-curses win10toast
- macOS:
osascript(built-in)- Optional:
terminal-notifier(brew install terminal-notifier)
- Linux:
sudo apt install libnotify-bin
- Clone or download this repository.
- Install any Windows requirements if needed.
- Run the dashboard:
python epoch_curses_dashboard.py
- Press
qto quit.
Edit the top of epoch_curses_dashboard.py to adjust:
INTERVAL = 10    # refresh interval in seconds
TIMEOUT  = 1     # socket timeout in seconds
SERVICES = [
    ("Auth Server", "198.244.165.233", 3724),
    ("Kezan (PvE)", "198.244.165.233", 8085),
    ("Gurubashi (PvP)", "198.244.165.233", 8086),
    ("Cloudflare", "1.1.1.1", 443),
]