🇨🇳 简体中文 🇪🇸 Español 🇫🇷 Français 🇩🇪 Deutsch 🇯🇵 日本語 🇷🇺 Русский 🇰🇷 한국어 🇧🇷 Português 🇺🇸 English
In this course, you will learn how to use Seaborn, a Python library for producing statistical graphics. You will learn how to use Seaborn's sophisticated visualization tools to analyze your data, create informative visualizations, and communicate your results with ease.
| Index | Name | Difficulty | Practice |
|---|---|---|---|
| 1 | 📖 Seaborn Data Visualization Basics | Beginner | Start Lab |
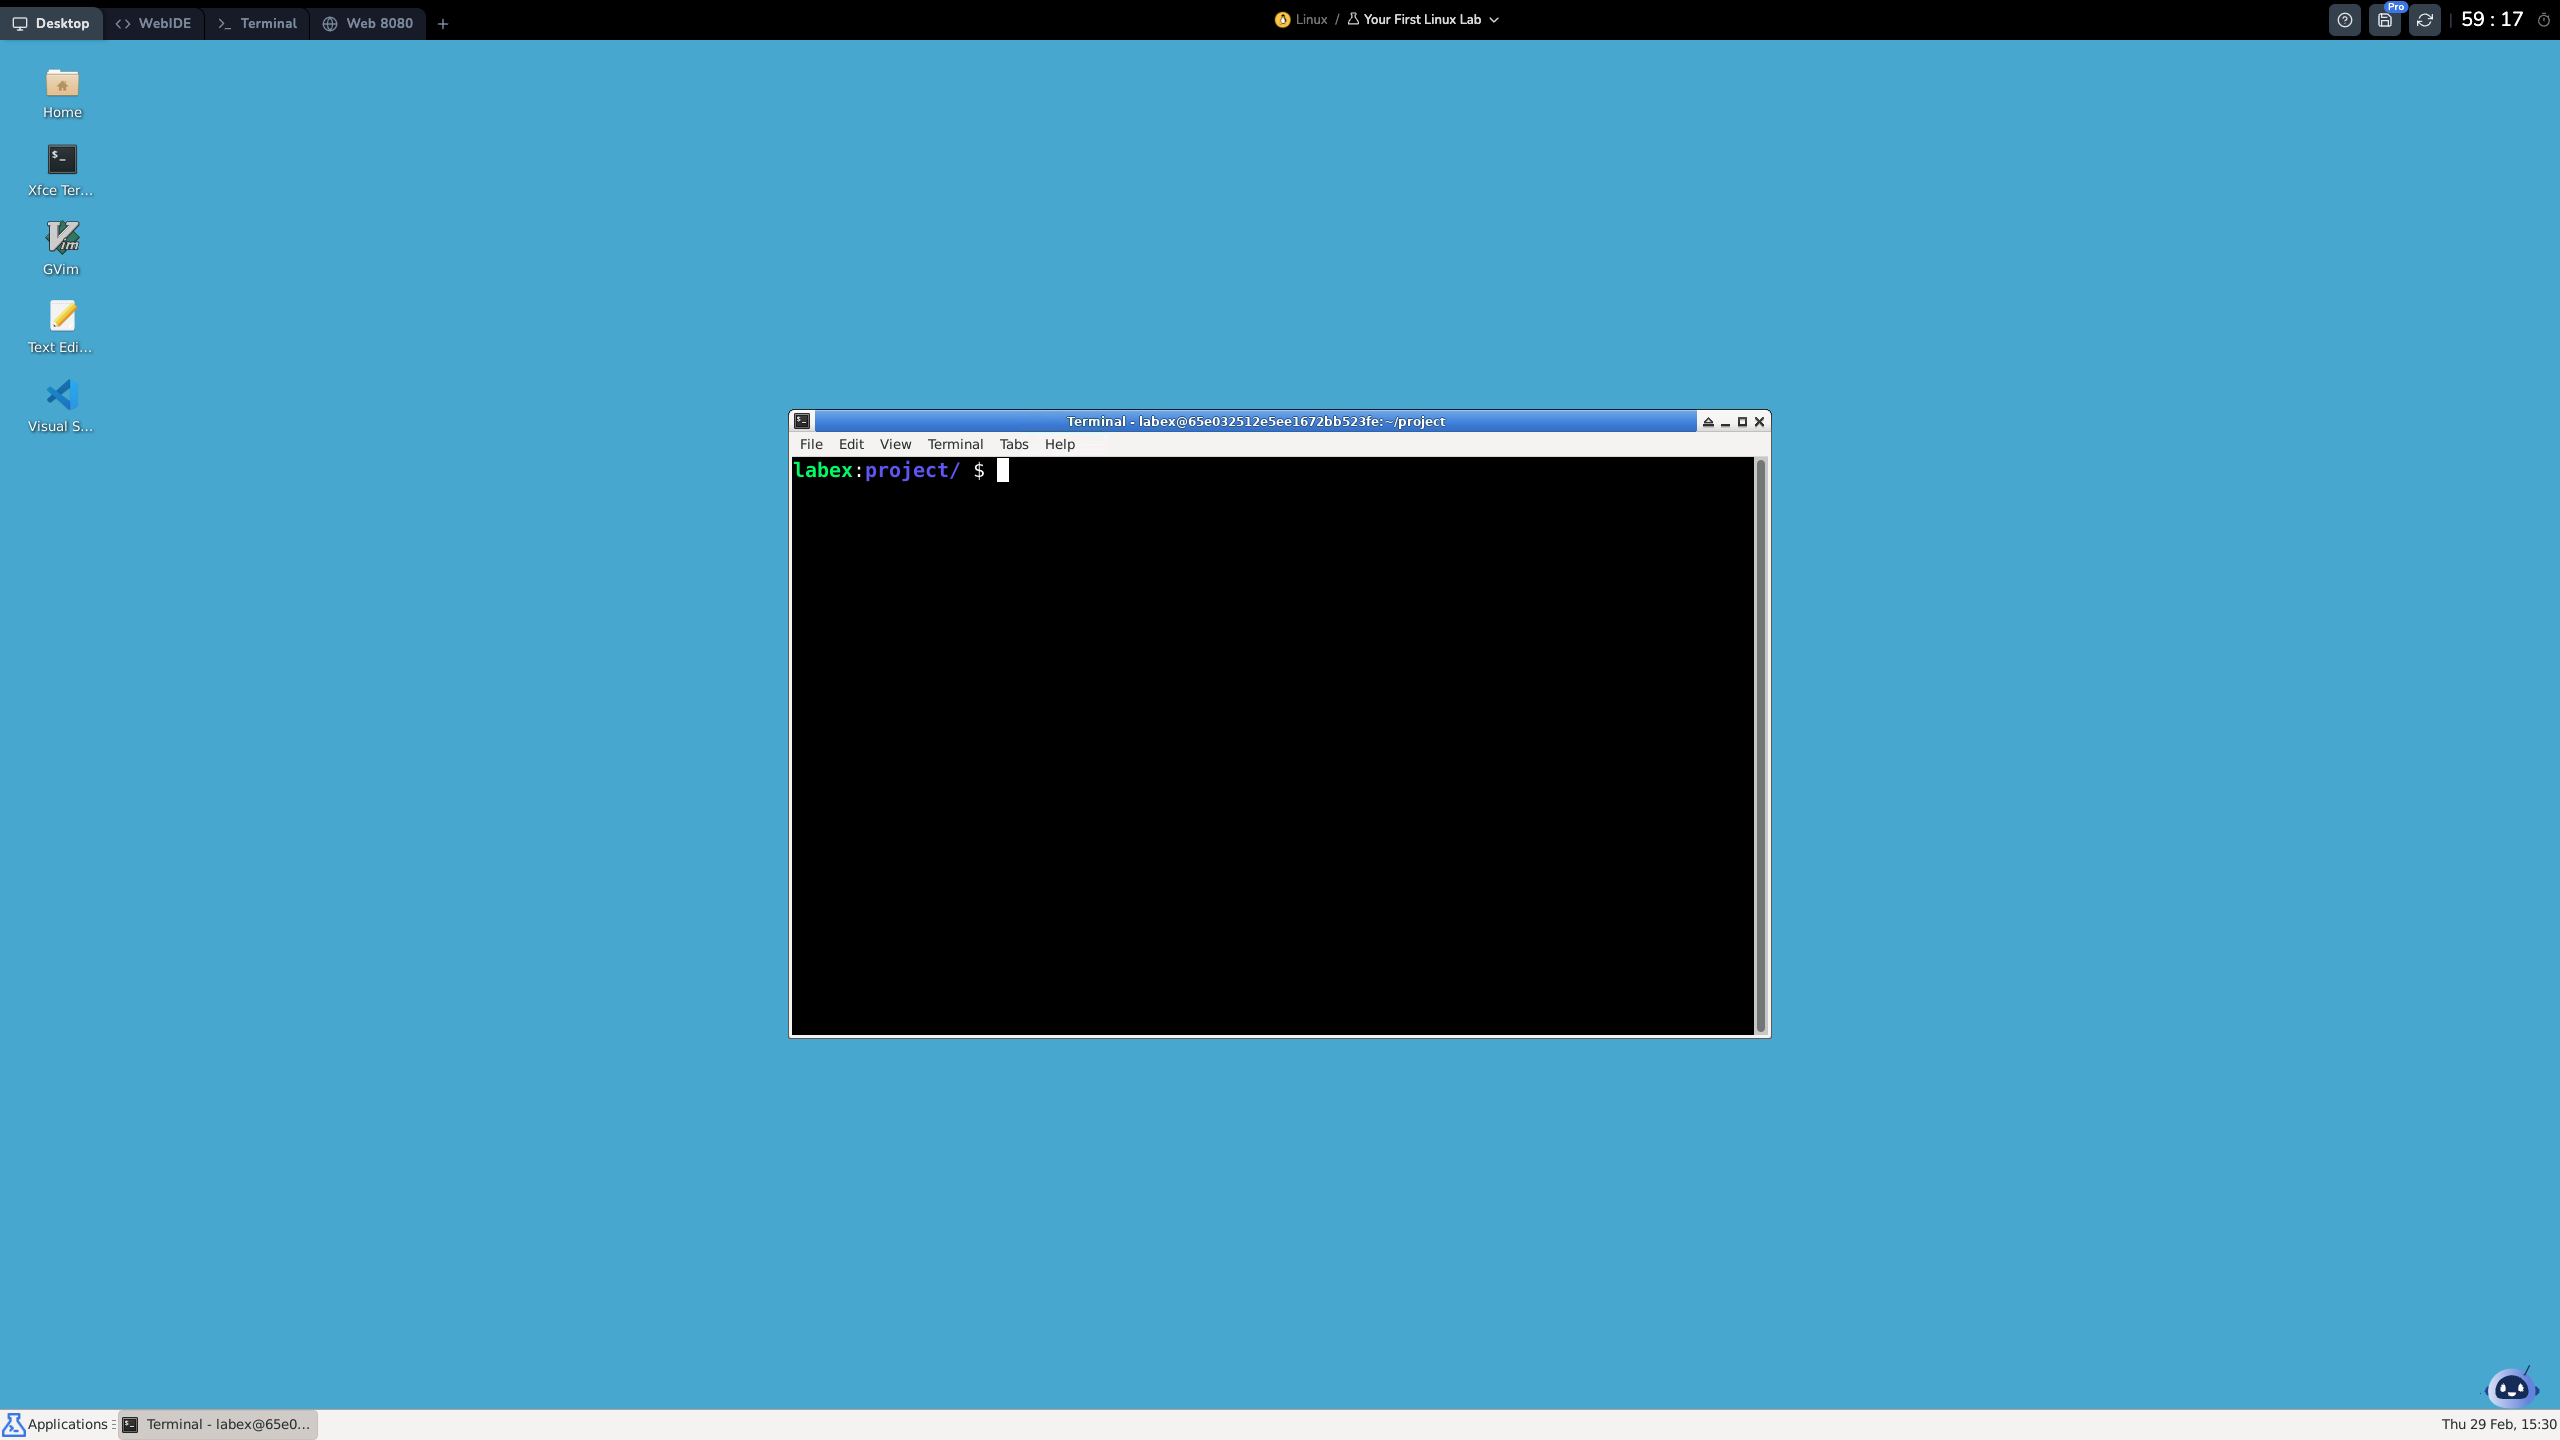
LabEx is an interactive, hands-on learning platform dedicated to coding and technology. It combines labs, AI assistance, and virtual machines to provide a no-video, practical learning experience.
- A strict "Learn by Doing" approach with exclusive hands-on labs and no videos.
- Interactive online environments within the browser, with automated step-by-step checks.
- A structured content organization with the Skill Tree based learning system.
- A growing learning resource of 30 Skill Trees and over 6,000 Labs.
- The learning assistant Labby, built on lastest AI models, providing a conversational learning experience.
Learn more about LabEx VM.


