2. Forecast
The Forecast page provides forecasts for Issues.
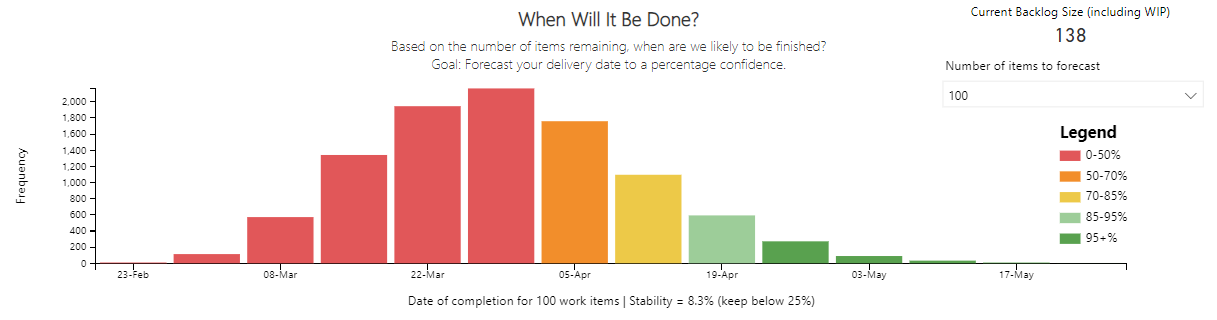
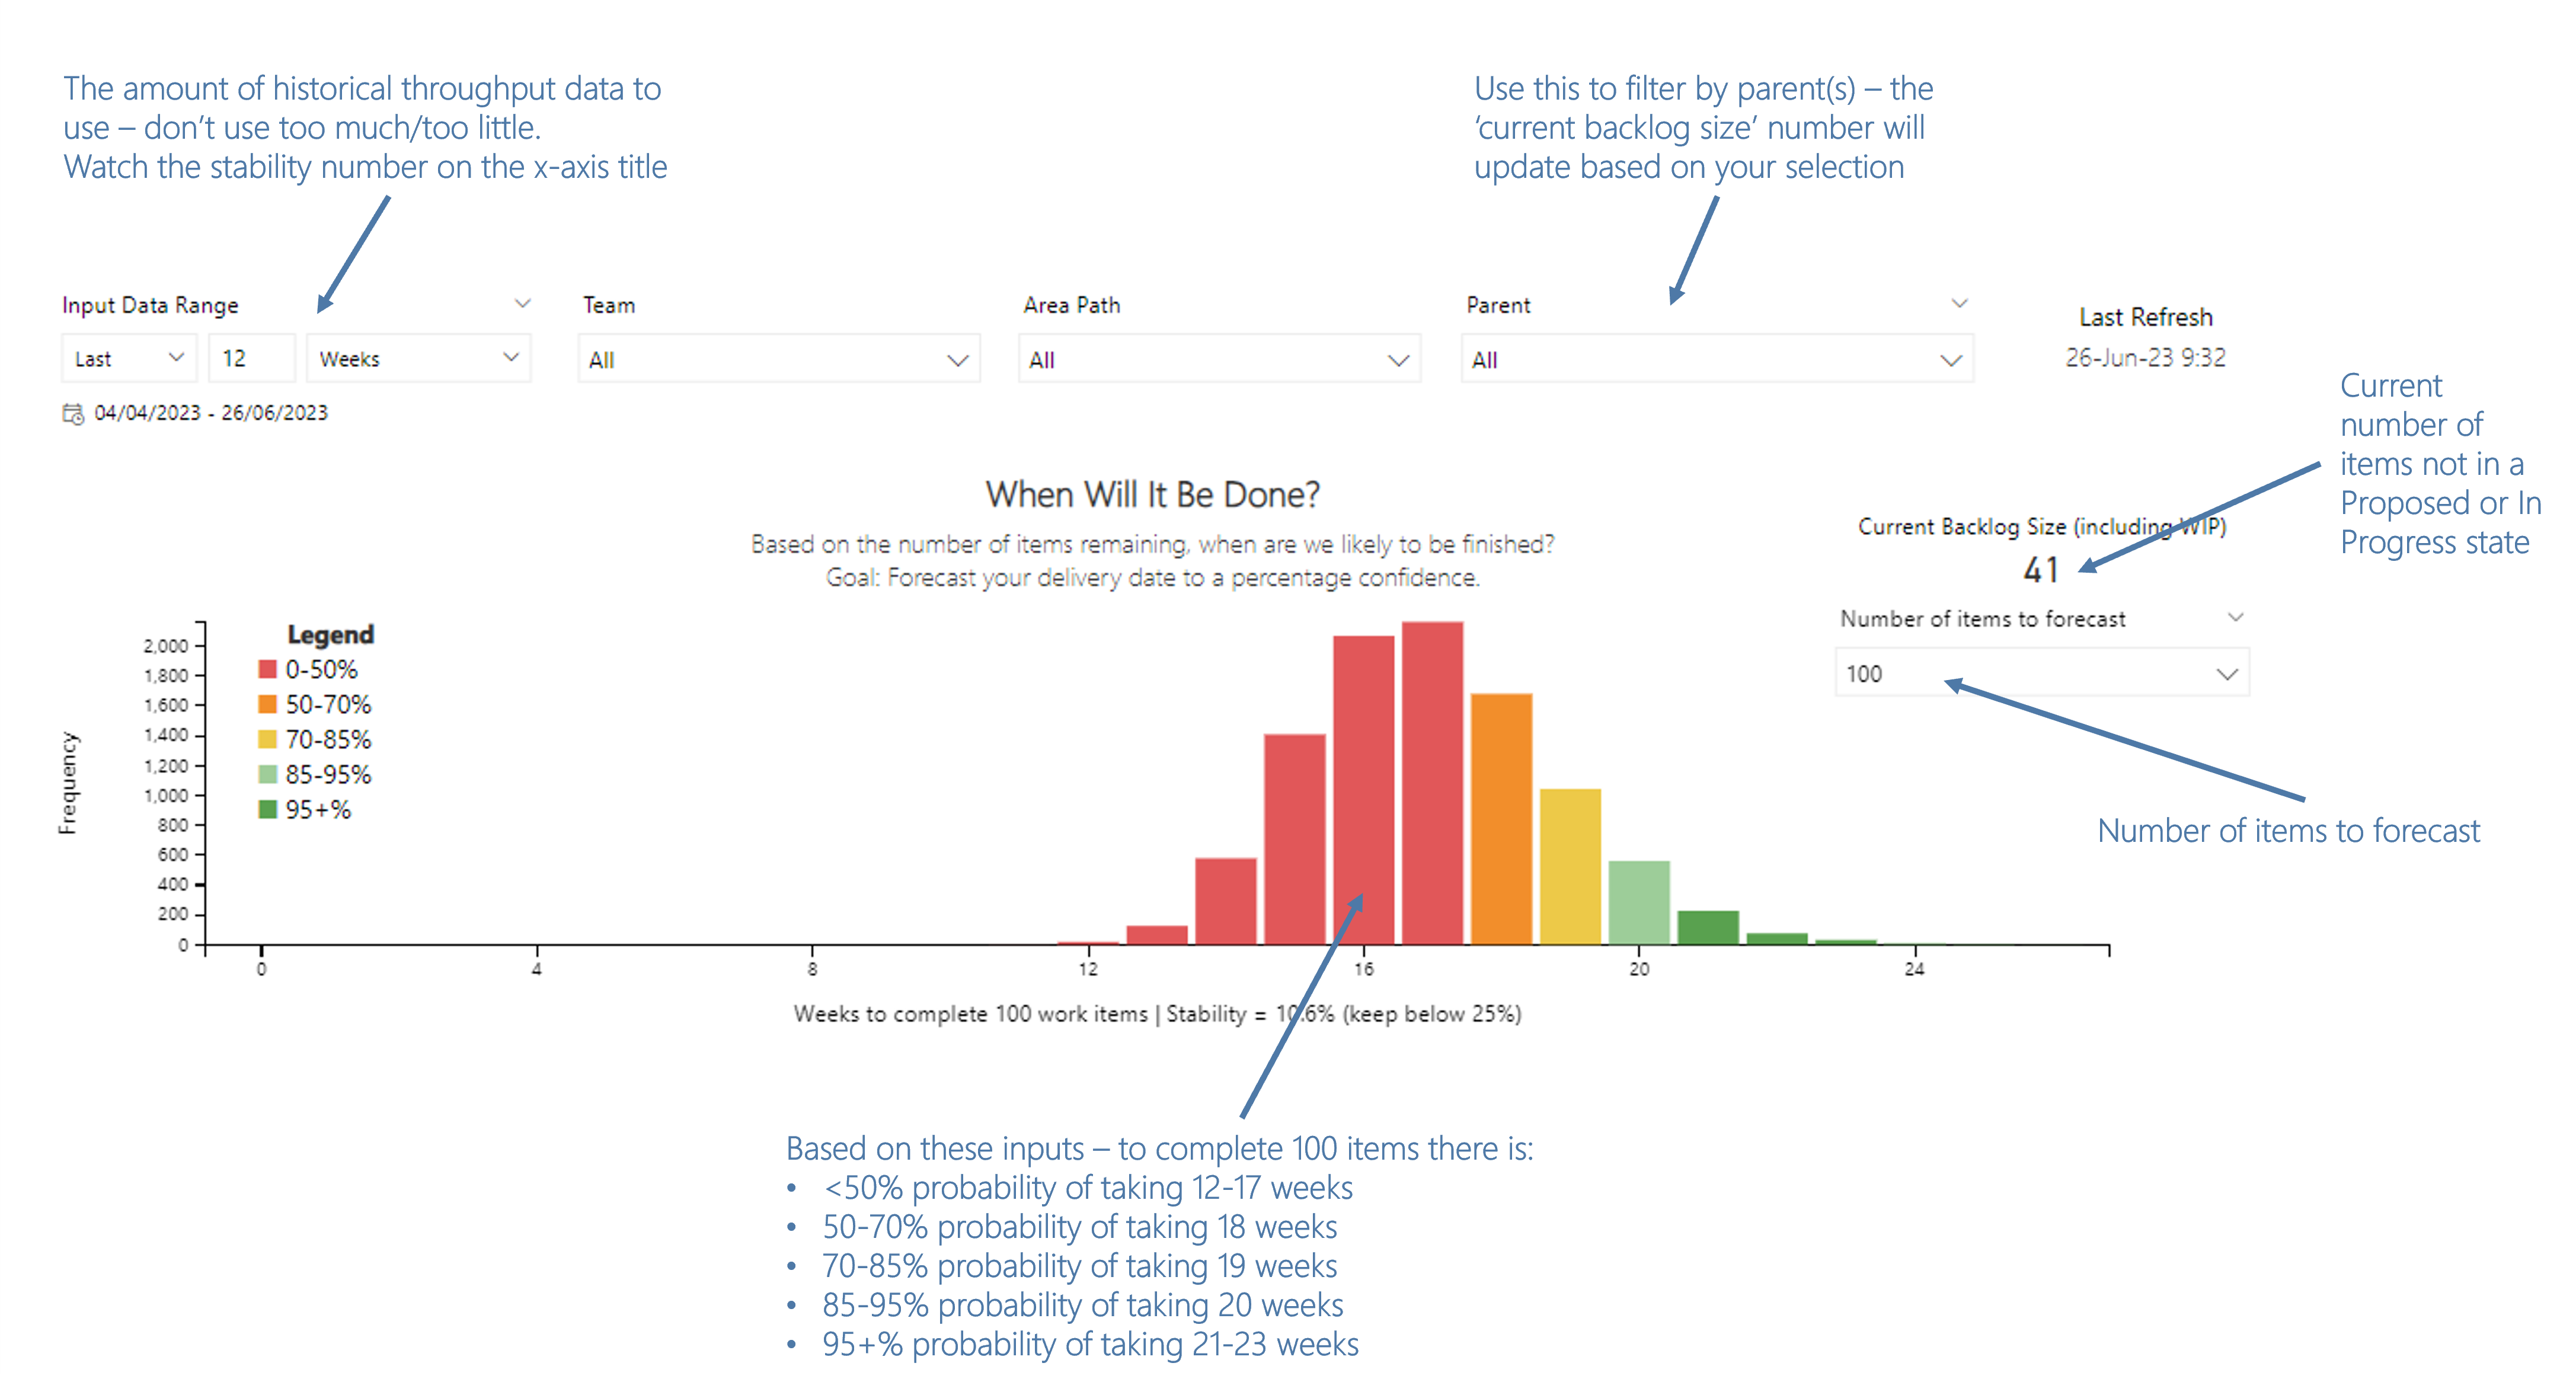
What is this chart?
Based on the number of items to forecast (drop down), what is the percentage likelihood of completion in number of weeks.
The chart runs 10,000 simulations of different scenarios using the historical throughput data of the last 12 weeks (controlled via the input data range filter). The output is a distribution of these simulations in number of weeks to complete, with percentiles of likelihood. As well as this, the throughput stability percentage is shown (aim to keep this below 25%).
The current backlog size number is based on the number of open Issues.
What is the intended behaviour?
Software development is complex. Traditional estimation from teams normally produces a single result and does not produce a likelihood of meeting that result. More often than not the result presented is only 50% likely due to dividing the remaining work by the average. This means the odds of that result are a coin-toss. This method allows the reader/customer/client to choose the amount of risk they wish to sign-up to, in particular if they want to deliver ‘everything’.
How is it misused?
Only using it at the beginning of the project/product development. It should be continually inspected as part of your product/project progress. Another common mistake is not throwing away ‘old data’, which is something you should do if context/domain/team size changes. Use this chart to see if ‘everything’ is needed and re-prioritise scope.
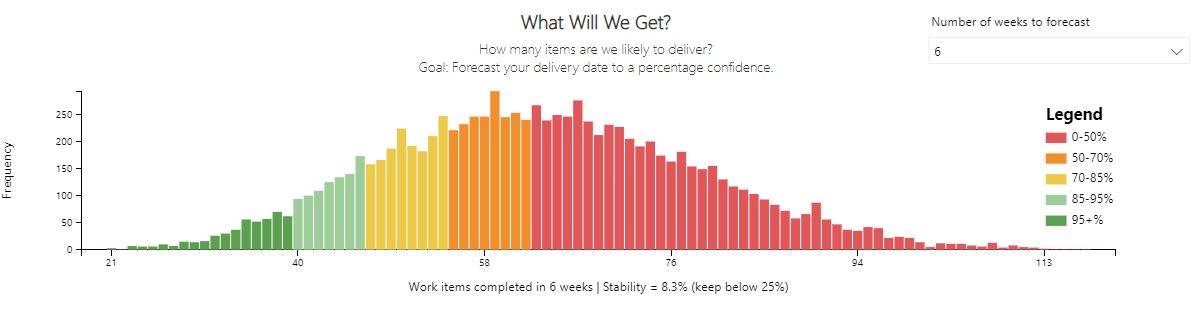
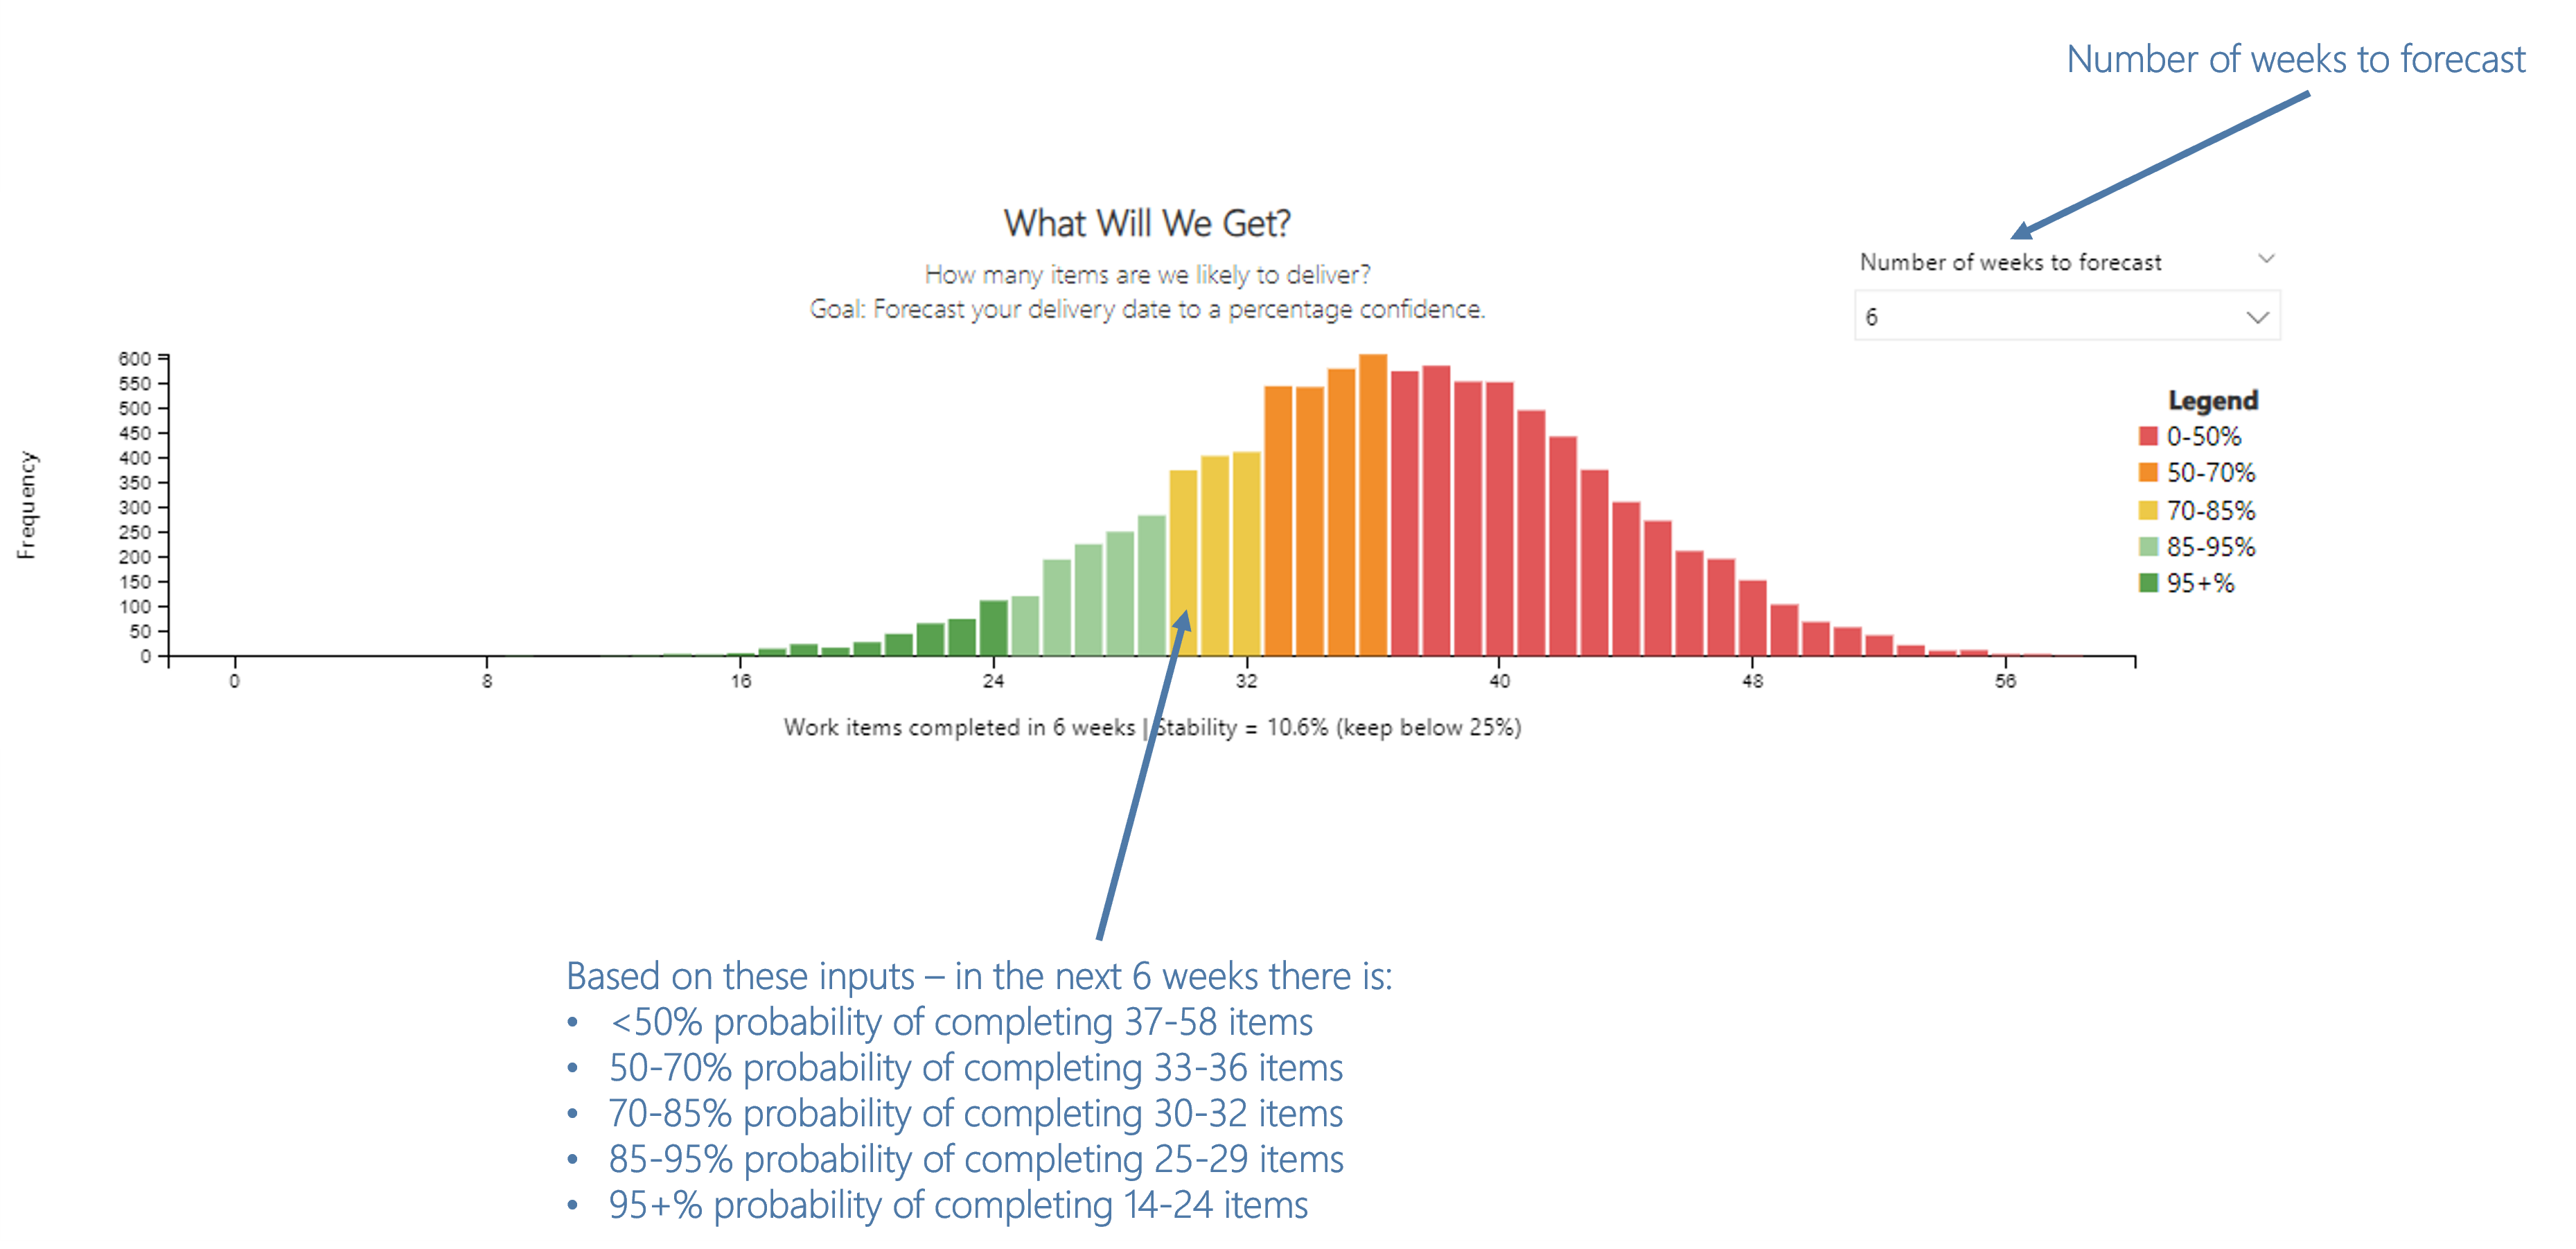
What is this chart?
Based on the number of weeks to forecast (drop down), what is the percentage likelihood of completion in number of items.
The chart runs 10,000 simulations of different scenarios using the historical throughput data of the last 12 weeks (controlled via the input data range filter). The output is a distribution of these simulations in number of items forecast to be delivered, with percentiles of likelihood. As well as this, the throughput stability percentage is shown (aim to keep this below 25%).
What is the intended behaviour?
Software development is complex. Traditional estimation from teams normally produces a single result and does not produce a likelihood of meeting that result. More often than not the result presented is only 50% likely due to dividing the remaining work by the average. This means the odds of that result are a coin-toss. This method allows the reader/customer/client to choose the amount of risk they wish to sign-up to, in particular if they have expectations that differ from both the team and what the data shows.
How is it misused?
Only using it at the beginning of the project/product development. It should be continually inspected as part of your product/project progress. Another common mistake is not throwing away ‘old data’, which is something you should do if context/domain/team size changes. Use this chart to see if re-prioritisation is needed, or if we should focus on slicing items.