Created by Neha Deshpande on 2/4/2022
- Download your Spotify data here: https://support.spotify.com/us/article/data-rights-and-privacy-settings/
- Download
SortSongs.pyand move it into the folder\my_spotify_data\MyData\ - Run the following command from a terminal:
python SortSongs.py
Three new files will be created: SortedSongs.txt, SortedArtists.txt, and SortedLikedSongs.txt.
SortedSongs.txt will be in the following format, with each line being a different song.
Number of times played -- Song Name -- Artist Name
SortedArtists.txt will be in the following format, with each line being a different artist.
Number of times played -- Artist Name
SortedLikedSongs.txt displays the number of times each of the liked songs are played. It will be in the following format, with each line being a different artist.
Number of times played -- Song Name -- Artist Name
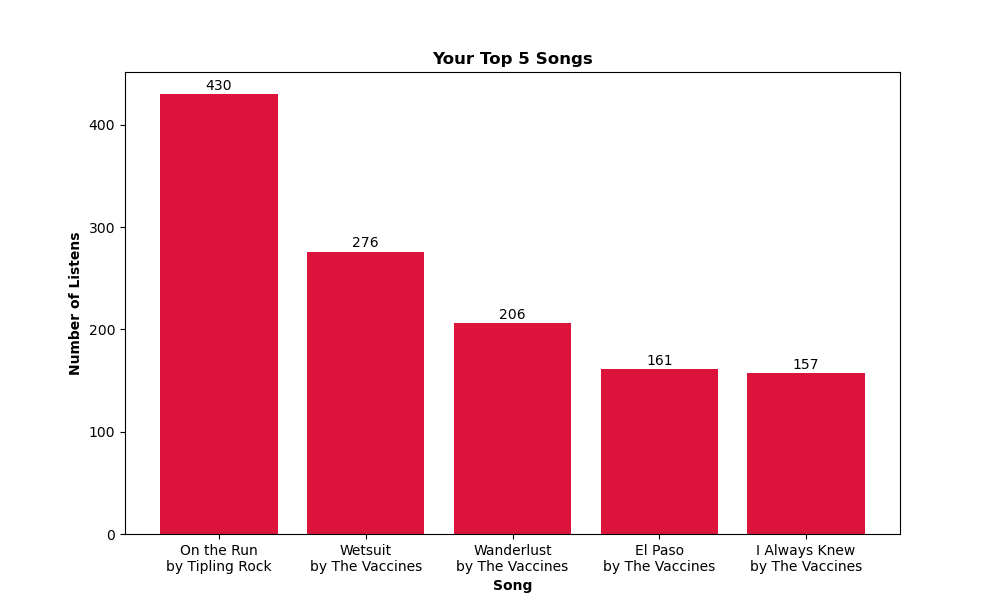
To graph your top songs and artists, run the following. [Number] is how many you want to graph. The default is 5:
python SortSongs.py -graph [Number]
This will result in two graphs being saved to the same folder as above. 'SortedSongs.png' displays your top [Number] songs and 'SortedArtists.png' displays your top [Number] artists. Examples of these are shown below. Note, matplotlib is required for graphing.