![]()
⚠️ IMPORTANT: Configuration Required
prom-analytics-proxyis a man-in-the-middle proxy that sits between your query clients (Grafana, Perses, etc.) and your metrics backend (Prometheus, Thanos, Cortex).You MUST reconfigure your query clients to point at the proxy (default port
:9091) instead of directly to your metrics backend. Without this reconfiguration, the proxy will not capture any query traffic and you will see no analytics data.
- Overview
- Architecture
- Quick Start
- Features
- Project Structure
- Configuration
- Troubleshooting
- API Reference
prom-analytics-proxy is a powerful observability tool that acts as a transparent proxy between your Prometheus server and its clients. It provides deep insights into your PromQL query patterns, helping you optimize performance and resource usage while maintaining complete visibility into your monitoring stack.
Learn how prom-analytics-proxy can help you gain insights into your Prometheus queries and optimize your monitoring setup.
prom-analytics-proxy works as an intercepting proxy that must be placed between your query clients and your metrics backend. Understanding this architecture is crucial for successful deployment.
graph TB
    subgraph clients["Query Clients"]
        A[Grafana]
        B[Perses]
        C[Custom Apps]
    end

    subgraph proxy["prom-analytics-proxy :9091"]
        D[Proxy Layer]
        E[Analytics Collection]
        F[Web Dashboard]
    end

    subgraph storage["Storage Layer"]
        G[(PostgreSQL/SQLite<br/>Query History)]
    end

    subgraph backend["Metrics Backend"]
        H[Prometheus/Thanos/Cortex<br/>:9090]
    end

    A -->|"① Configure datasource to :9091"| D
    B -->|"① Configure datasource to :9091"| D
    C -->|"① Send queries to :9091"| D
    D -->|"② Forward queries"| H
    H -->|"③ Return results"| D
    D -->|"④ Return results"| A
    D -->|"Capture metadata"| E
    E -->|"Store analytics"| G
    F -->|"Display insights"| G
- Query Interception: Your query clients (Grafana, Perses, etc.) send PromQL queries to the proxy instead of directly to your metrics backend
- Query Forwarding: The proxy forwards these queries to your actual Prometheus/Thanos/Cortex instance
- Analytics Capture: While proxying, it captures query patterns, execution times, series counts, and other metadata
- Result Passthrough: Query results are returned to the client transparently, maintaining full compatibility
- Data Storage: Analytics data is stored in PostgreSQL or SQLite for analysis
- Visualization: The built-in web UI provides insights into your query patterns and performance
- The proxy adds minimal latency to queries (typically <10ms)
- It's completely transparent to query clients - they see the same API as Prometheus
- No changes are required to your metrics backend
- The proxy supports all PromQL query types (instant, range, series, labels, etc.)
- Works with Prometheus, Thanos, Cortex, and any Prometheus-compatible backend
Get up and running in 3 simple steps:
git clone https://github.com/nicolastakashi/prom-analytics-proxy.git
cd prom-analytics-proxy
make build
./prom-analytics-proxy -upstream http://your-prometheus-server:9090
The proxy listens on port :9091 by default.
Critical: Update your query clients (Grafana, Perses, etc.) to send queries to the proxy at port :9091 instead of directly to your metrics backend.
Example for Grafana: Change your Prometheus datasource URL from http://prometheus:9090 to http://prom-analytics-proxy:9091.
Open http://localhost:9091 and execute some queries through your clients. You should see analytics data appear in the UI.
📖 See the complete Quick Start Guide for detailed setup instructions, configuration examples, and deployment patterns.
Want to see it in action? Use our ready-to-run example:
cd examples
docker compose up -d
This starts a complete stack with Prometheus, the proxy, PostgreSQL, Perses dashboards, and Metrics Usage tracking. Access the proxy UI at http://localhost:9091.
See the examples/ directory for configuration templates and integration examples.
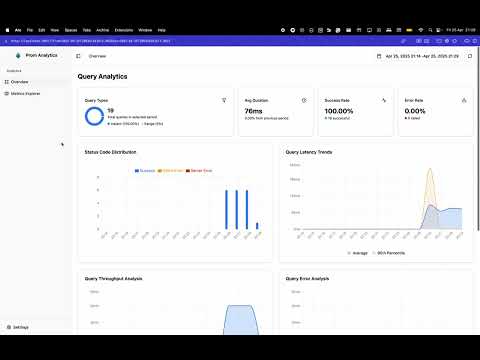
- Detailed statistics on PromQL queries
- Execution time tracking
- Resource consumption metrics
- Series count analysis
- Integration with Perses Metrics Usage
- Multi-source data correlation
- Comprehensive metrics tracking
- Learn more about Metrics Usage Integration
- PostgreSQL support
- SQLite support
- Flexible storage options
- Efficient data management
- Uses Goose with embedded SQL migrations per dialect (PostgreSQL and SQLite)
- Migrations run automatically at startup; prefer a single init step in production
- Intuitive web-based dashboard
- Query performance visualization
- Query Shortcuts for common patterns
- Real-time analytics
The project is organized into two main components:
- Go-based proxy application
- Query analytics collection
- Performance metrics processing
- Data storage management
- React-based user interface
- Data visualization
- Query analysis tools
- Interactive dashboards
The application can be configured through command-line flags or a configuration file. Here are the key configuration options:
# Example configuration
upstream: "http://prometheus:9090"
insecure-listen-address: ":9091"
database-provider: "postgresql" # or "sqlite"# PostgreSQL
postgresql-addr: "localhost"
postgresql-port: 5432
postgresql-database: "prom_analytics"
postgresql-user: "user"
postgresql-password: "password"
# SQLite
sqlite-database-path: "prom-analytics-proxy.db"insert-batch-size: 10
insert-buffer-size: 100
insert-flush-interval: "5s"
insert-grace-period: "5s"
insert-timeout: "1s"Usage:
./bin/prom-analytics-proxy [command] [flags]
Commands:
api Run the proxy server (default)
ingester Run metrics ingester (experimental)
Flags (api):
-config-file string
Path to the configuration file, it takes precedence over the command line flags.
-database-provider string
The provider of database to use for storing query data. Supported values: postgresql, sqlite.
-include-query-stats
Request query stats from the upstream prometheus API. (default true)
-insecure-listen-address string
The address the prom-analytics-proxy proxy HTTP server should listen on. (default ":9091")
-insert-batch-size int
Batch size for inserting queries into the database. (default 10)
-insert-buffer-size int
Buffer size for the insert channel. (default 100)
-insert-flush-interval duration
Flush interval for inserting queries into the database. (default 5s)
-insert-grace-period duration
Grace period to insert pending queries after program shutdown. (default 5s)
-insert-timeout duration
Timeout to insert a query into the database. (default 1s)
-inventory-enabled
Enable the metrics inventory syncer (default true)
-inventory-job-index-label-timeout duration
Timeout for job label values collection (default 30s)
-inventory-job-index-per-job-timeout duration
Timeout for processing each individual job (default 30s)
-inventory-job-index-workers int
Number of worker goroutines for job index processing (default 10)
-inventory-metadata-timeout duration
Timeout for metadata collection step (default 30s)
-inventory-run-timeout duration
Timeout for the entire inventory sync run (default 5m0s)
-inventory-summary-timeout duration
Timeout for summary refresh step (default 30s)
-inventory-sync-interval duration
Interval between inventory sync runs (default 10m0s)
-inventory-time-window duration
Time window for inventory data collection (default 720h0m0s)
-log-format string
Log format (text, json) (default "text")
-log-level string
Log level (default "INFO")
-memory-limit-enabled
Enable automatic GOMEMLIMIT management via automemlimit
-memory-limit-ratio float
Ratio (0 < ratio <= 1) of detected memory limit used for GOMEMLIMIT (default 0.9)
-memory-limit-refresh-interval duration
Interval for refreshing the computed memory limit (0 disables refresh) (default 1m0s)
-metadata-limit uint
The maximum number of metric metadata entries to retrieve from the upstream prometheus API. (default 0 which means no limit)
-postgresql-addr string
Address of the postgresql server. (default "localhost")
-postgresql-conn-max-idle-time duration
Maximum amount of time a connection may be idle before being closed (0 = use default 5m).
-postgresql-conn-max-lifetime duration
Maximum amount of time a connection may be reused (0 = use default 30m).
-postgresql-database string
Database for the postgresql server, can also be set via POSTGRESQL_DATABASE env var.
-postgresql-dial-timeout duration
Timeout to dial postgresql. (default 5s)
-postgresql-max-idle-conns int
Maximum number of idle connections in the pool (0 = use default 10).
-postgresql-max-open-conns int
Maximum number of open connections to the database (0 = use default 20).
-postgresql-password string
Password for the postgresql server, can also be set via POSTGRESQL_PASSWORD env var.
-postgresql-port int
Port of the postgresql server. (default 5432)
-postgresql-sslmode string
SSL mode for the postgresql server. (default "disable")
-postgresql-user string
Username for the postgresql server, can also be set via POSTGRESQL_USER env var.
-push-metrics-usage-timeout duration
Timeout for PushMetricsUsage API endpoint (default 30s). (default 30s)
-retention-enabled
Enable the retention worker to delete old data
-retention-interval duration
Interval between retention runs (default 1h0m0s)
-retention-queries-max-age duration
Maximum age for queries before deletion (default 720h0m0s)
-retention-run-timeout duration
Timeout for each retention run (default 5m0s)
-series-limit uint
The maximum number of series to retrieve from the upstream prometheus API. (default 0 which means no limit)
-sqlite-database-path string
Path to the sqlite database. (default "prom-analytics-proxy.db")
-upstream string
The URL of the upstream prometheus API.
Flags (metrics ingester):
-config-file string
Path to the configuration file, it takes precedence over the command line flags.
-database-provider string
The provider of database to use for retrieving query data. Supported values: postgresql, sqlite.
-ingester-allowed-jobs value
Comma-separated list of allowed jobs to ingest metrics from
-ingester-cache-addr string
Cache server address (host:port)
-ingester-cache-db int
Cache database number
-ingester-cache-enabled
Enable metric usage caching
-ingester-cache-password string
Cache password (optional)
-ingester-cache-unused-ttl duration
TTL for caching 'unused' metric states (default 2m0s)
-ingester-cache-used-only
Only cache 'used' states, never cache 'unused' states
-ingester-cache-used-ttl duration
TTL for caching 'used' metric states (default 1h0m0s)
-ingester-cache-username string
Cache username (optional)
-ingester-denied-jobs value
Comma-separated list of denied jobs to ingest metrics from
-ingester-drain-delay duration
Delay after marking NOT_SERVING before shutdown begins (default 2s)
-ingester-dry-run
When true, performs filtering analysis and records metrics but does not actually drop any data
-ingester-graceful-timeout duration
Max time to wait for graceful shutdown (default 30s)
-ingester-metrics-listen-address string
The HTTP address to expose Prometheus metrics (default ":9090")
-ingester-protocol string
Metrics ingestion protocol (otlp) (default "otlp")
-log-format string
Log format (text, json) (default "text")
-log-level string
Log level (default "INFO")
-memory-limit-enabled
Enable automatic GOMEMLIMIT management via automemlimit
-memory-limit-ratio float
Ratio (0 < ratio <= 1) of detected memory limit used for GOMEMLIMIT (default 0.9)
-memory-limit-refresh-interval duration
Interval for refreshing the computed memory limit (0 disables refresh) (default 1m0s)
-otlp-balancer-name string
gRPC load balancer name for downstream OTLP client (e.g., round_robin). If empty, defaults to pick_first
-otlp-downstream-address string
Optional downstream OTLP gRPC address to forward filtered metrics
-otlp-downstream-connect-backoff-multiplier float
Multiplier applied to downstream OTLP client dial backoff (default 1.6)
-otlp-downstream-connect-base-delay duration
Base delay for downstream OTLP client dial backoff (default 250ms)
-otlp-downstream-connect-max-delay duration
Max delay for downstream OTLP client dial backoff (default 5s)
-otlp-downstream-connect-min-timeout duration
Minimum connect timeout for downstream OTLP client dial attempts (default 500ms)
-otlp-downstream-max-recv-bytes int
Max gRPC receive message size for downstream OTLP client (bytes) (default 10485760)
-otlp-downstream-max-send-bytes int
Max gRPC send message size for downstream OTLP client (bytes) (default 10485760)
-otlp-downstream-retry-backoff-multiplier float
Downstream OTLP retry backoff multiplier (default 1.6)
-otlp-downstream-retry-codes value
Comma-separated gRPC status codes to retry (e.g., UNAVAILABLE,RESOURCE_EXHAUSTED)
-otlp-downstream-retry-initial-backoff duration
Downstream OTLP retry initial backoff (duration) (default 250ms)
-otlp-downstream-retry-max-attempts int
Downstream OTLP retry max attempts (default 2)
-otlp-downstream-retry-max-backoff duration
Downstream OTLP retry max backoff (duration) (default 1s)
-otlp-listen-address string
The address the metrics ingester should listen on. (default ":4317")
-otlp-lookup-chunk-size int
Batch size for database lookups when checking metric usage (default 500, SQLite max 999) (default 500)
-otlp-max-recv-bytes int
Max gRPC receive message size for OTLP server (bytes) (default 10485760)
-otlp-max-send-bytes int
Max gRPC send message size for OTLP server (bytes) (default 10485760)
-postgresql-addr string
Address of the postgresql server. (default "localhost")
-postgresql-conn-max-idle-time duration
Maximum amount of time a connection may be idle before being closed (0 = use default 5m).
-postgresql-conn-max-lifetime duration
Maximum amount of time a connection may be reused (0 = use default 30m).
-postgresql-database string
Database for the postgresql server, can also be set via POSTGRESQL_DATABASE env var.
-postgresql-dial-timeout duration
Timeout to dial postgresql. (default 5s)
-postgresql-max-idle-conns int
Maximum number of idle connections in the pool (0 = use default 10).
-postgresql-max-open-conns int
Maximum number of open connections to the database (0 = use default 20).
-postgresql-password string
Password for the postgresql server, can also be set via POSTGRESQL_PASSWORD env var.
-postgresql-port int
Port of the postgresql server. (default 5432)
-postgresql-sslmode string
SSL mode for the postgresql server. (default "disable")
-postgresql-user string
Username for the postgresql server, can also be set via POSTGRESQL_USER env var.
-sqlite-database-path string
Path to the sqlite database. (default "prom-analytics-proxy.db")The prom-analytics-proxy application includes built-in support for distributed tracing using OpenTelemetry. To enable tracing, you must provide a configuration file specifying the tracing settings. Below is an example configuration and details for each option:
tracing:
  client_type: ""
  service_name: ""
  resource_attributes: {}
  reconnection_period: 0s
  compression: ""
  insecure: false
  endpoint: ""
  url_path: ""
  timeout: 0s
  retry_config:
    retry_enabled: false
    retry_initial_interval: 0s
    retry_max_interval: 0s
    retry_max_elapsed_time: 0s
  headers: {}
  tls_config:
    ca_file: ""
    cert_file: ""
    key_file: ""
    server_name: ""
    insecure_skip_verify: false
  sampler_type: ""
sampler_param: ""The prom-analytics-proxy application integrates with Perses Metrics Usage to gather and correlate metrics usage data from multiple sources. Essentially, prom-analytics-proxy acts as a backend for the Metrics Usage frontend, providing the data needed to populate the UI.
Because Metrics Usage is a separate project, you must deploy it alongside prom-analytics-proxy to enable this feature. Once configured, prom-analytics-proxy sends the collected data to the Metrics Usage backend, which is then displayed in the Metrics Usage UI. For more information, see the Metrics Usage repository.
Try it out: The examples/docker-compose.yaml includes a complete setup with Metrics Usage integration. Configuration files are available in examples/config/metrics-usage/.
The inventory syncer maintains a catalog of metrics and their usage patterns. It uses concurrent processing to handle large numbers of jobs efficiently. It can be configured with the following options:
inventory:
  enabled: true # Enable inventory syncing (default: true)
  sync_interval: 10m # How often to sync inventory (default: 10m)
  time_window: 720h # Time window for usage analysis (default: 30 days)
  run_timeout: 30s # Timeout for entire sync run (default: 30s)
  metadata_step_timeout: 15s # Timeout for metadata fetch (default: 15s)
  summary_step_timeout: 10s # Timeout for usage summary refresh (default: 10s)
  job_index_label_timeout: 10s # Timeout for job label fetch (default: 10s)
  job_index_per_job_timeout: 5s # Timeout per job for series fetch (default: 5s)
  job_index_workers: 10 # Number of concurrent workers for job processing (default: 10)
Performance Notes:
- For environments with hundreds of jobs (500+), increase
job_index_workersto 20-50 for faster processing - Increase
run_timeoutproportionally when processing many jobs (e.g., 300s for 1000+ jobs) - Each worker processes one job at a time, so more workers = faster job index building
Not seeing any data in the UI?
The most common issue is that query clients are still connecting directly to your metrics backend instead of through the proxy. Make sure you've reconfigured your clients (Grafana, Perses, etc.) to use the proxy URL (:9091).
Context deadline exceeded errors?
Your metrics backend may be slow to respond. Increase timeout values, especially for large Thanos deployments:
./prom-analytics-proxy \
  -upstream http://thanos:9090 \
  -inventory-job-index-per-job-timeout 60s \
  -inventory-run-timeout 10m
Performance issues?
Tune the insert buffer settings and consider using PostgreSQL instead of SQLite for better concurrent write performance.
📖 See the complete Troubleshooting Guide for detailed solutions to common issues, performance tuning, and debugging tips.
The proxy provides several API endpoints for accessing query analytics and metrics inventory data:
GET /api/v1/queries- Retrieve query analytics data with pagination and filtering
GET /api/v1/seriesMetadata- Retrieve metrics catalog and usage information
page(int): Page number for pagination (default: 1)pageSize(int): Number of items per page (default: 10, max: 100)sortBy(string): Sort field -name,type,alertCount,recordCount,dashboardCount,queryCount(default:name)sortOrder(string): Sort direction -ascordesc(default:asc)filter(string): Filter metrics by name or help texttype(string): Filter by metric type -counter,gauge,histogram,summary, etc.unused(boolean): Filter to show only unused metrics (no alerts, recording rules, dashboards, or queries)job(string): Filter to show metrics produced by a specific job
# Get all metrics with pagination
curl "http://localhost:9091/api/v1/seriesMetadata?page=1&pageSize=20"

# Find unused metrics
curl "http://localhost:9091/api/v1/seriesMetadata?unused=true"

# Find unused metrics for a specific job
curl "http://localhost:9091/api/v1/seriesMetadata?unused=true&job=myapp"

# Search for HTTP-related metrics
curl "http://localhost:9091/api/v1/seriesMetadata?filter=http&type=counter"{
"data": [
{
"name": "http_requests_total",
"type": "counter",
"help": "Total number of HTTP requests",
"unit": "",
"alertCount": 2,
"recordCount": 1,
"dashboardCount": 3,
"queryCount": 45,
"lastQueriedAt": "2024-01-15T10:30:00Z",
"seriesCount": 12
}
],
"pagination": {
"page": 1,
"pageSize": 20,
"total": 150,
"totalPages": 8
}
}POST /api/v1/query/push Push query data to the server, for cases when you have other means of collecting PromQL queries stats.
[
  {
    "type": "instant",                     // REQUIRED Type of the query, one of `range` or `instant`
    "query_param": "up{job='foobar'}",     // REQUIRED The PromQL expression of the query
    "time_param": "2024-01-15T10:30:00Z",  // The time when the query was evaluated, only for type `instant` in RFC 3339 format
    "duration": 250000000,                 // Duration of the query in nanoseconds
    "status_code": 200,                    // REQUIRED Valid HTTP status code, see https://go.dev/src/net/http/status.go
    "body_size": 512,                      // Response body size in bytes
    "step": 15,                            // REQUIRED(for type `range`) Range query step in seconds
    "start": "2024-01-15T10:30:00Z",       // REQUIRED(for type `range`) Range query start time in RFC 3339 format
    "end": "2024-01-15T10:30:00Z",         // REQUIRED(for type `range`) Range query end in RFC 3339 format
    "total_queryable_samples": 1000,       // Total samples that were queryable
    "peak_samples": 1000,                  // Maximum samples processed at any point in time
  },
  ...
]The inventory system automatically discovers metrics from your Prometheus server and tracks their usage across:
- Alerting rules: Metrics used in alert expressions
- Recording rules: Metrics used in recording rule expressions
- Dashboards: Metrics queried by dashboard panels (when integrated with dashboard usage tracking)
- Ad-hoc queries: Direct PromQL queries through the proxy
When the job parameter is provided with unused=true, the system:
- Filters metrics to only those produced by the specified job (using the job index)
- Applies the global "unused" criteria (no usage in alerts, recording rules, dashboards, or queries)
- Returns the series count for that specific job
This helps identify metrics that are being produced by a service but aren't being actively monitored or used.