Historical monthly averages (1864-present) of temperature and precipitation at weather stations across Switzerland. All data is from MeteoSwiss and their license applies to its usage. I have only combined and transformed the data so it is more code-friendly.
- Data source
- Measurement details (PDF, German)
| Station code | Station name |
|---|---|
| BER | Bern / Zollikofen |
| BAS | Basel / Binningen |
| CHM | Chaumont |
| CHD | Château-d'Oex |
| GSB | Col du Grand St-Bernard |
| DAV | Davos |
| ENG | Engelberg |
| GVE | Genève-Cointrin |
| LUG | Lugano |
| PAY | Payerne |
| SIA | Segl-Maria |
| SIO | Sion |
| SAE | Säntis |
| SMA | Zürich / Fluntern |
-
get_meteoswiss.py gets multiple .txt files from meteoswiss.ch and transforms data:
-
JSON file: meteoswiss.json
-
python module: meteoswiss.py.
-
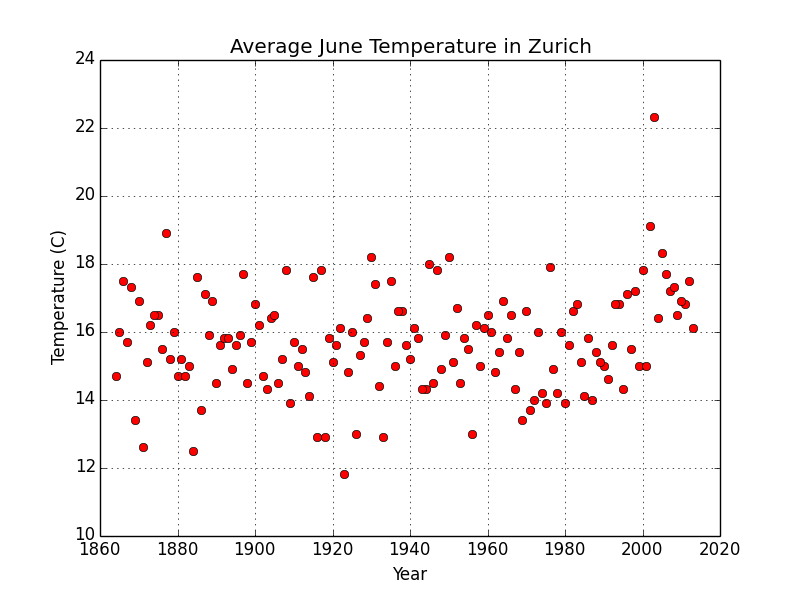
plot_zurich_temps.py is an example code:
-
loads data from meteoswiss.py
-
selects only Zürich (SMA) as the weather station
-
selects only average June temperatures
-
makes a plot of historical June temperatures in Zürich
from meteoswiss import meteoswiss

yearlist = []
templist = []
for station in meteoswiss:
	print station, ':', meteoswiss[station]['station_name']
	if station == 'SMA': # only Zurich temps
		temps = meteoswiss[station]['temp']
		for key,value in temps.iteritems():
			month = key.split('-')[-1]
			if month == '06': # only June
				yearlist.append(key.split('-')[0])
				templist.append(value)

import matplotlib.pyplot as plt
plt.plot(yearlist,templist,'ro')
plt.xlabel('Year')
plt.ylabel('Temperature (C)')
plt.title('Average June Temperature in Zurich')
plt.grid(True)
plt.show()