Enable Diagnostics
This guide will help you enable detailed verbose diagnostics information that are useful to devs to tackle the issues and bugs. First we need to enable diagnostics and then we need to download them.
Open Settings page and look for a faded diag? word on the bottom left of the page.

Click on that and confirm Are you sure to enable diagnostics? message. Then you'll be notified that diagnostics are enabled and a new tab will bring you here (..again? :)
Now the diagnostics are enabled. Please not that diagnostics are enabled for this session and that means by closing browser everything will be back to normal.
Do the actions that you have asked to or do things that you think are not working properly.
To download you can do either of these.
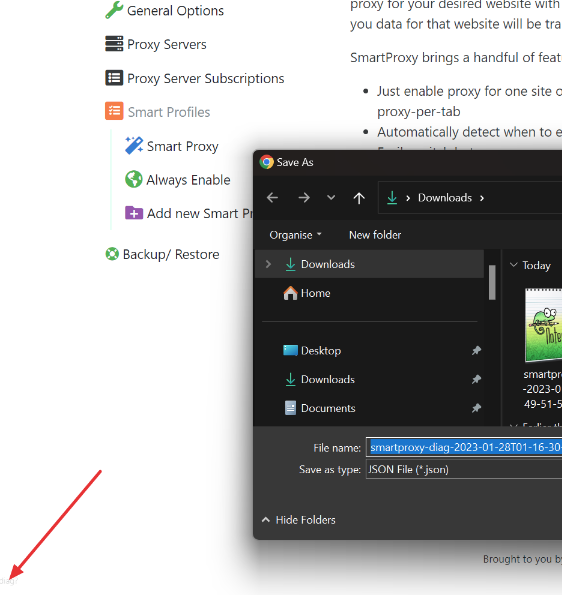
Simply click on the diag? word again and you'll be receive a download containing the logs. The file format should be something like smartproxy-diagnostics-{time}.json
You are done and don't need to the next step. 👍
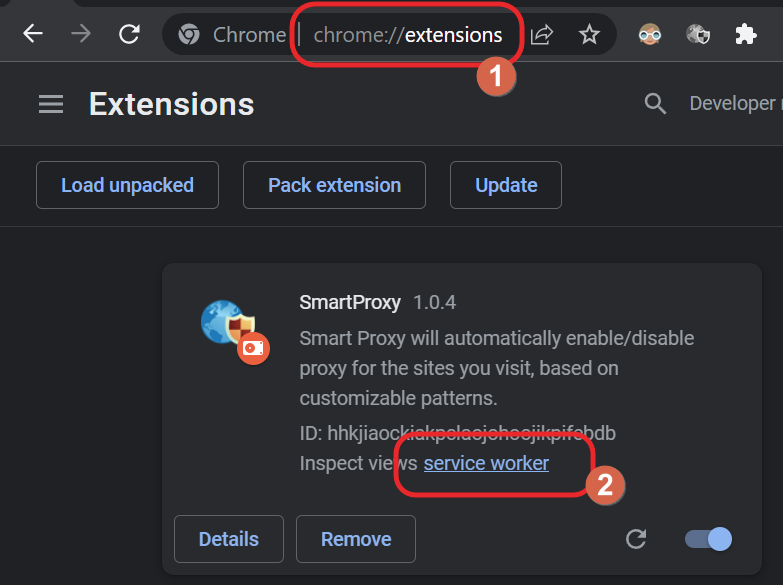
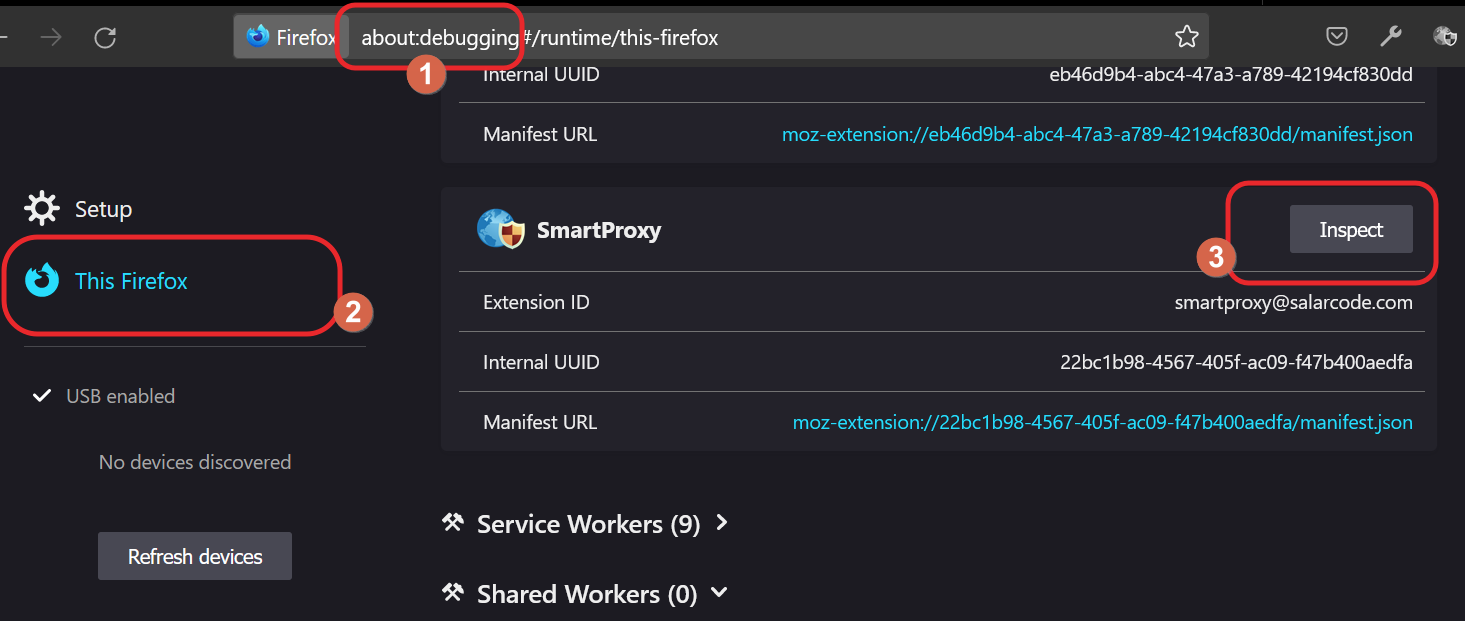
Another way of downloading the logs is from debugging console
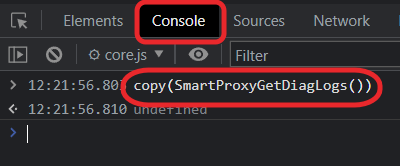
Now that Console is open enter command copy(SmartProxyGetDiagLogs()). This will copy logs to clipboard, now paste the content to a text file in notepad and send it over.
Please send the logs as instructed via email to the devs.
The diagnostics information most likely will contain sensitive information like the pages you've visited (full url only) or the proxy servers you have added to your extension with their username/passwords. DO NOT SHARE THE LOGS in public.