

A very simple Python oscilloscope for displaying 1-dim dynamic data in the command line.
- Easy to integrate (no third-party libraries required)
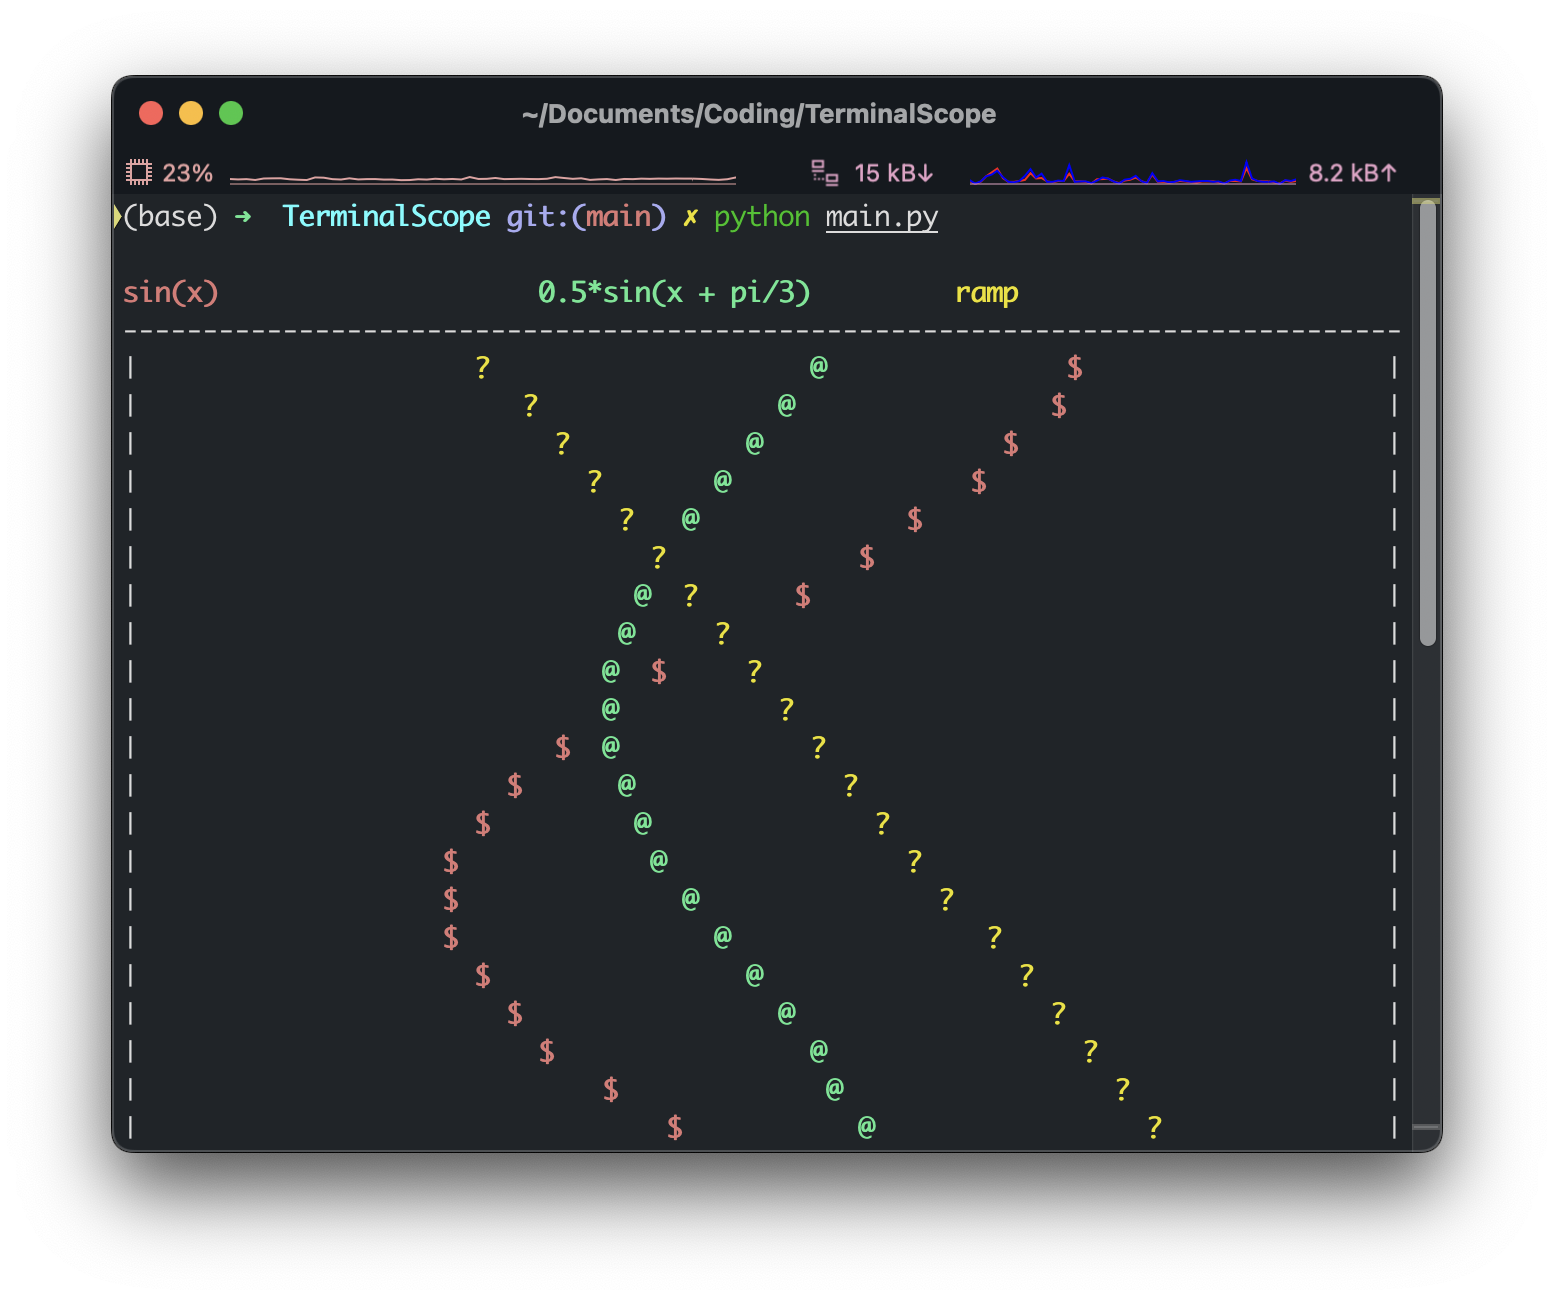
- Support for multiple variables with different colors and symbols
- Lightweight and cross-platform compatibility (Windows, macOS, Linux, etc.)
- Typical use cases:
- Accessing your Raspberry Pi via SSH and wanting to display sensor data in real-time
- Debugging your motor PID controller and needing a simple graphical user interface
- Python 3.7+
- No external dependencies
- Compatible with any terminal that supports ANSI color codes
pip install tscopegit clone https://github.com/sszxc/TerminalScope.git
cd TerminalScope
pip install -e .import math
import time
from tscope import TerminalScope
# Create a scope with 3 variables
scope = TerminalScope(["sin(x)", "cos(x)", "ramp"], data_range=(-2, 2))
# Plot data
for i in range(100):
x = i * 0.1
scope.plot([math.sin(x), math.cos(x), x % 2 - 1])
time.sleep(0.1)This project is licensed under the MIT License - see the LICENSE file for details.