Topics covered include:
- Reading and structuring data from multiple formats (CSV, Excel, fixed-width, text)
- Identifying and fixing common data quality issues (missing values, incorrect types, inconsistent units)
- Filtering, grouping, merging, and reshaping datasets using pandas
- Practical strategies for dealing with categorical vs numerical data
- Cleaning and analysing real-world datasets (including time series)
- Visualising results and checking that conclusions actually make sense
Given in conjunction with two notebboks:
-
Ex1.ipynb, which uses data we worked with in 2nd year for the of concepts mean, variance, the central limit theorem and A/B testing
Here it is used to introduce dataframes and how these can be combined
-
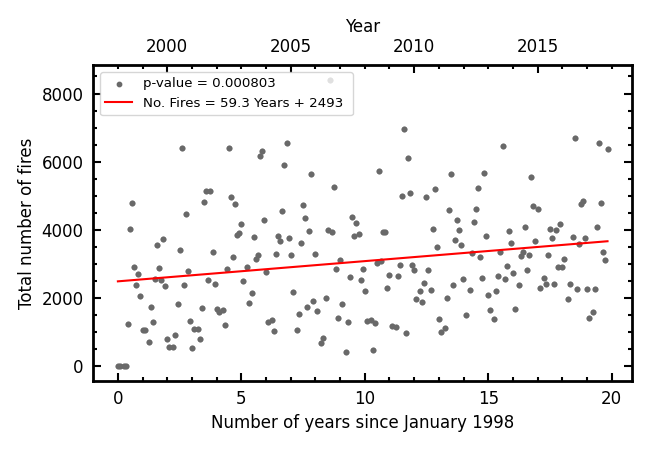
Ex2.ipynb, which uses data on the number of fires in the Amazon rainforest, to demonstrate some data cleaning and visualisation:
- Renaming parameters (column names), including the use of dictionaries
- Identifying problems with the data
- Stripping strings
- Missing values
- Grouping data
- Visualisation
- Time Series
- Significance and correlation
The latter of which shows that the number of fires has been steadily increasing over the range of the data (1998 - 2018)
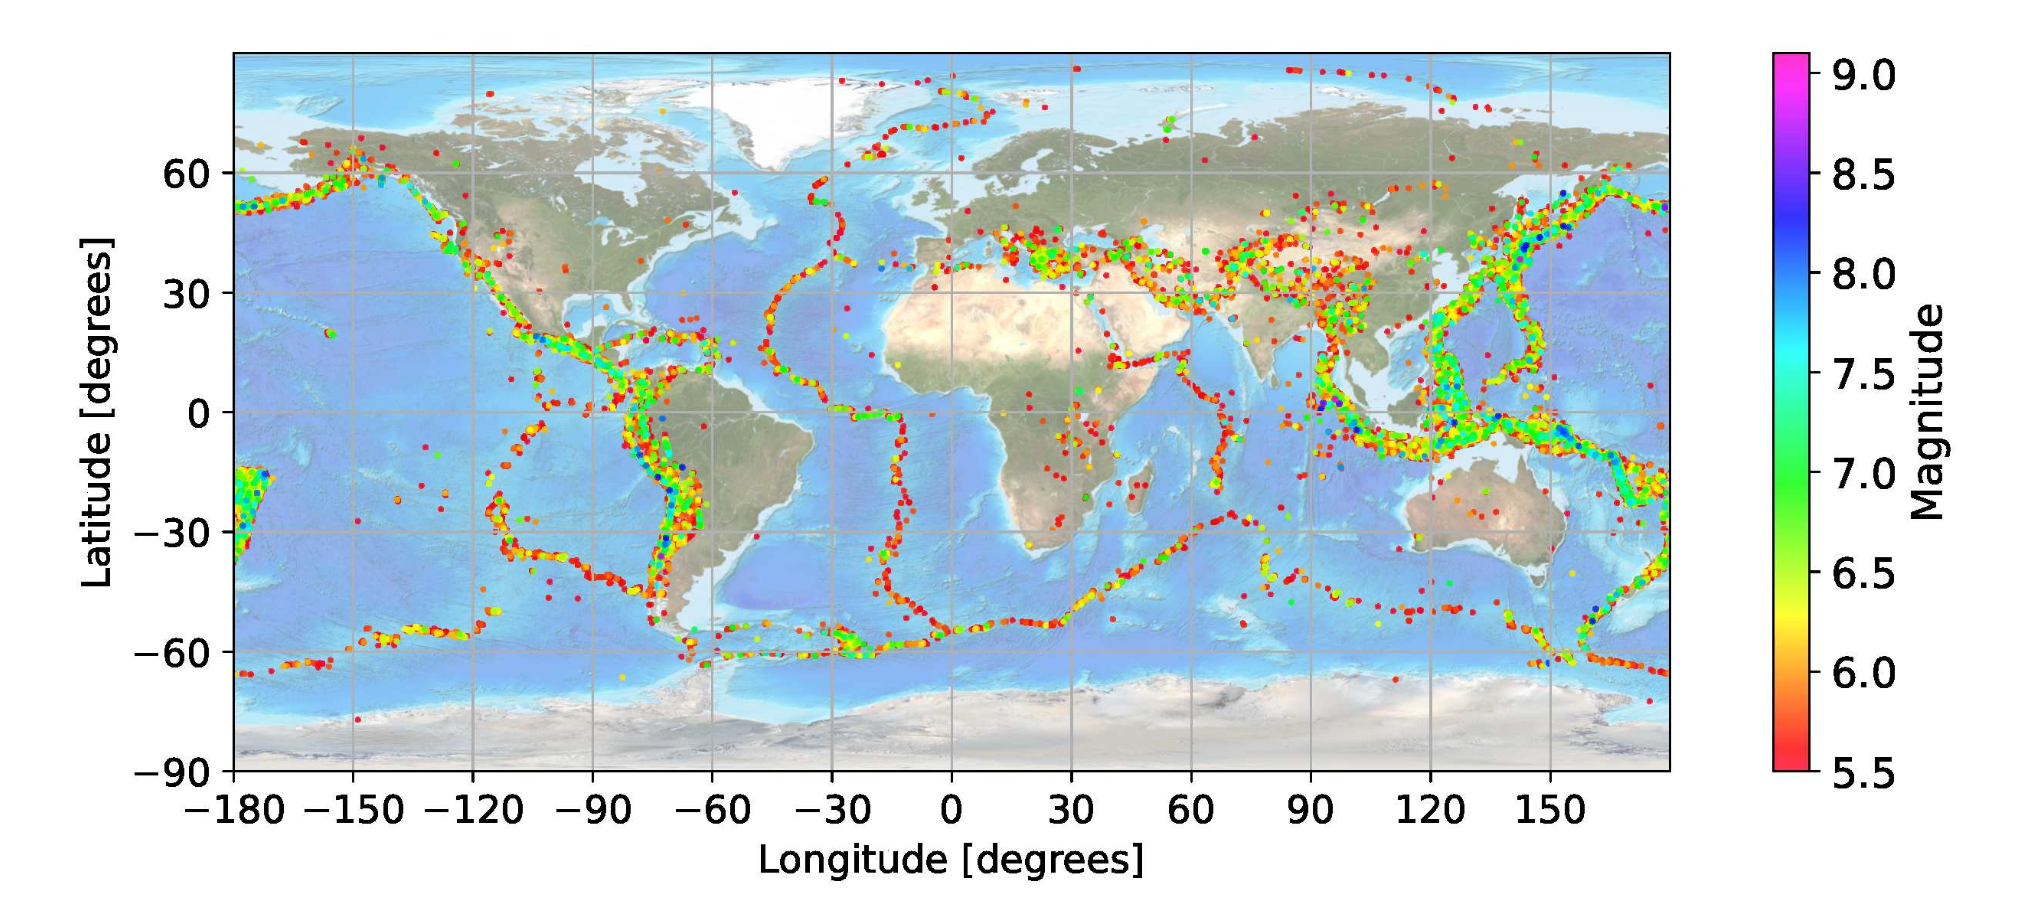
Question_bank.pdf contains two practical exercises with the solutions in quakes.ipynb and spectrum.py