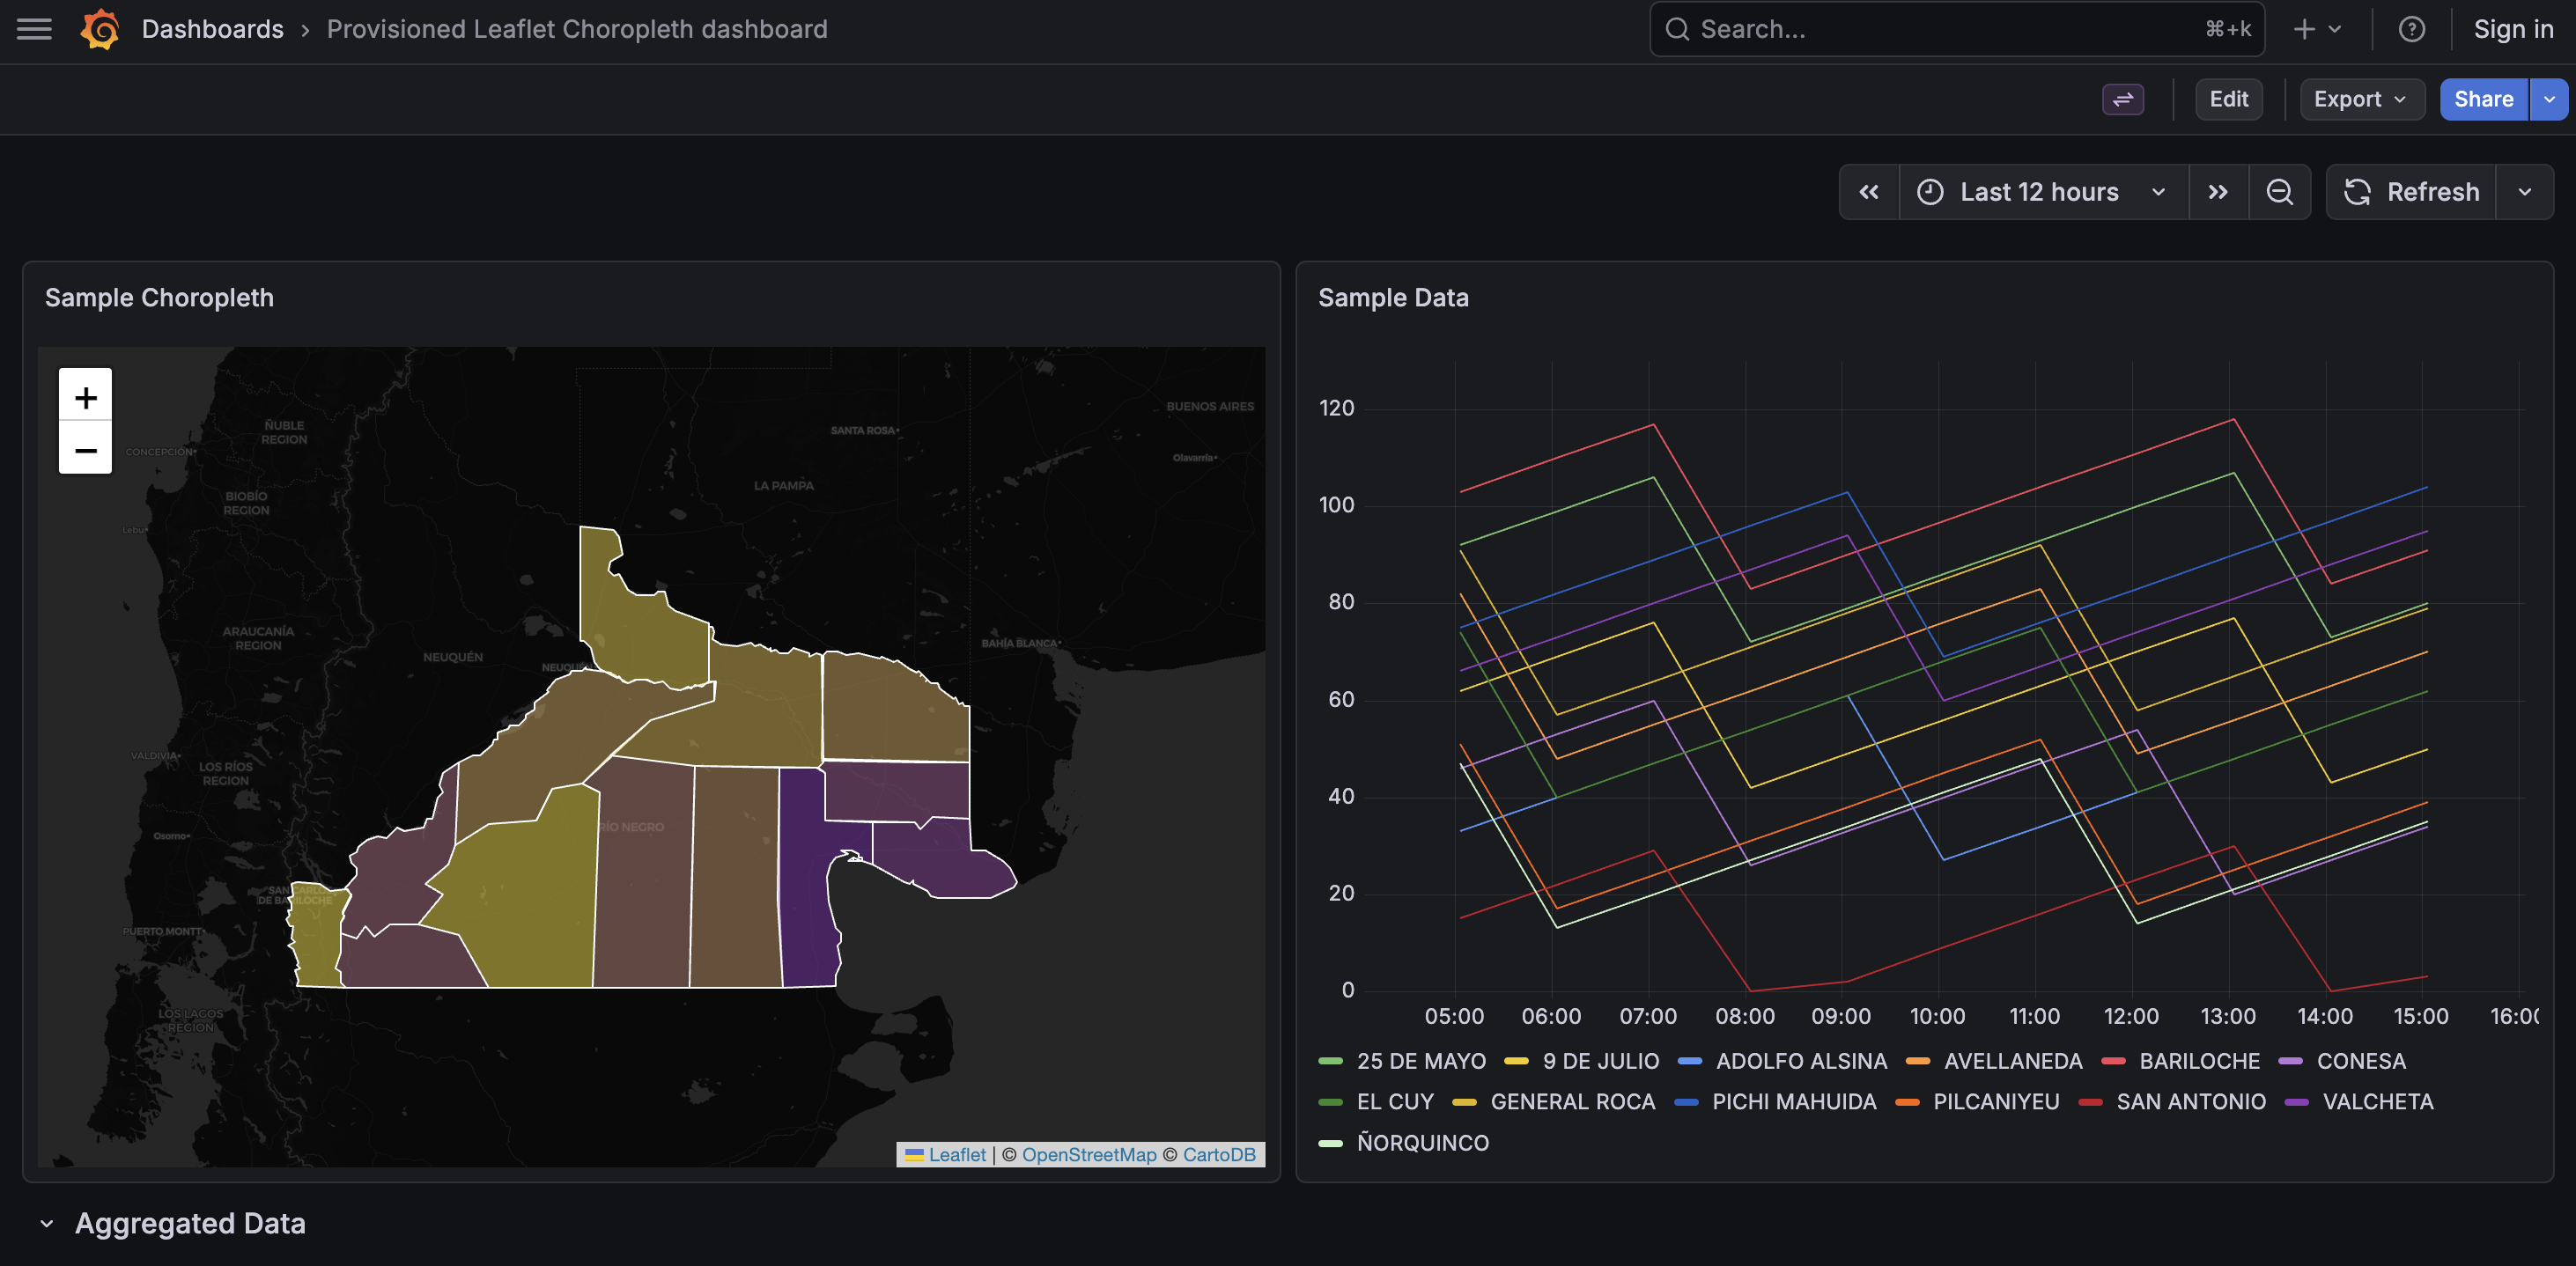
Cross-reference time-series metric data with GeoJSON to display colored polygons on a Leaflet map. A choropleth map shades regions proportionally to a statistical variable, making it easy to visualize how a measurement varies across geographic areas.
- Grafana >= 10.0.0
- Node.js >= 22 (see
.nvmrc) - pnpm (declared in
package.jsonpackageManagerfield) - Docker & Docker Compose (for the local dev environment)
Terminal 1 — start the webpack dev build in watch mode:
pnpm install
pnpm run dev
Terminal 2 — start the Docker Compose environment:
docker compose up --build
# or: pnpm run server
Then open http://localhost:3000 in your browser. A provisioned dashboard is loaded automatically.
Note: An Ahoy configuration (
.ahoy.yml) is included as an optional convenience wrapper around these commands.
docker compose up starts two services:
- Grafana (port 3000) — runs the plugin from the
dist/directory. Anonymous admin access is enabled so no login is required. A livereload script is injected into the Grafana HTML (see.docker/grafana/Dockerfile) so webpack rebuilds trigger automatic browser refresh. - InfluxDB 1.8 (port 8086) — pre-seeded with one year of hourly data via init scripts in
.docker/influxdb/.
A provisioned datasource and dashboard are auto-loaded from .docker/grafana/provisioning/ on startup.
These panel options are defined in src/module.ts:
| Option | Description | Default |
|---|---|---|
| GeoJSON Data | Fetch & store GeoJSON for the choropleth layer | — |
| Hot Color | Color for maximum values | #ff0000 |
| Cold Color | Color for minimum values | #0000ff |
| GeoJSON Key | Feature property used to match metric series | — |
| Auto Fit Bounds | Fit map to visible features on data refresh | true |
| Stroke Color | Border color of polygons | #ffffff |
| Stroke Width | Border width of polygons (0–10) | 1 |
| Fill Opacity | Opacity of polygon fill (0–1) | 0.5 |
The plugin matches Grafana metric series to GeoJSON features using a tag-based naming convention and colors polygons with a chroma-js quantile scale on a Leaflet map with CartoDB dark tiles.
Example: given a series named metric{departamento=CONESA} and GeoJSON Key set to departamento, the plugin finds the GeoJSON feature whose departamento property equals CONESA and assigns it a color. The color is interpolated between the Cold Color (minimum value) and the Hot Color (maximum value) using a chroma-js quantile scale across all matched features.
| Command | Description |
|---|---|
pnpm run dev |
Webpack watch mode (development) |
pnpm run build |
Production build |
pnpm run server |
Start Docker Compose environment |
pnpm run test |
Jest in watch mode (changed files only) |
pnpm run test:ci |
Jest single run (CI) |
pnpm run typecheck |
TypeScript type-check (tsc --noEmit) |
pnpm run lint |
ESLint |
pnpm run lint:fix |
ESLint auto-fix + Prettier |
Tests use Jest and React Testing Library.
pnpm run test      # watch mode — re-runs on changes
pnpm run test:ci # single run (used in CI)GitHub Actions (.github/workflows/ci.yml) runs on every push and PR to master:
- build — lint, typecheck, and production build (uploads
dist/as artifact) - test — runs
pnpm run test:ci - plugin-check — loads the built plugin into a Grafana container and verifies it is registered via the Grafana API
src/
  module.ts              — plugin entry point & panel option definitions
  types.ts               — ChoroplethOptions interface
  components/
    ChoroplethPanel.tsx  — main React panel component + data matching
    ChoroplethMap.ts     — Leaflet map rendering + chroma-js color scale
    GeoJsonEditor.tsx    — panel editor: fetch / preview / clear GeoJSON
    GeoJsonKeyEditor.tsx — panel editor: select feature property key