This project focuses on categorizing text data into predefined topics using diversified machine learning models. The key components include
- Exploratory Data Analysis (EDA)
- Feature preprocessing
- Embedding models (TF-IDF, BERT, Sentence BERT)
- Classification models (Logistic Regression, Random Forest, BERT)
- Incorporating with synthetic data
- Results and callouts
- Visualization helper
In the following sections, we outline the pipeline structure, design choices, results and potential improvements. The full implementation can be found in this link.
categorized-data.json- the JSON file consisting of predicted topics for theunprocessed-data.jsondata.Document_categorizer_using_synthetic_data.ipynb- the main notebook for this project, including the visualization helper. This notebook executes on Colab. Original Link.Synthetic_data_generator.ipynb- the notebook to generate synthetic data using Gretel API. Original Link*.png- the graphs generated by the visualization helper.
-
Text Preprocessing (only needed for TF-IDF):
- Removes special characters
- Applies tokenization, stop-word removal, and stemming to standardize text.
- Combines "question" and "expert" features into a single column. Note that this treatment is for illustration only, we can also treat them separately.
-
Embedding:
- Uses TF-IDF, SBERT or BERT to generate embeddings for the combined feature.
-
Classification:
- Used logistic regression and random forest as the simple classification approach.
- Fine-tune a BERT model (using QLoRA) for text classification task.
-
Synthetic Data:
- Utilized Gretel's API to generate 200K rows of synthetic training data based on the original processed data.
- Used the synthetic data as the additional training data to improve model performance.
-
Visualization:
- Carried out confusion matrix plot, topic-level classification metrics plot, prediction confidence distribution plot on the test data.
- Uses UMAP to reduce high-dimensional embeddings for a 2D scatter plot to visualize topic separability, on the test data.
- Before using synthetic data, the best performance model is TF-IDF + Logistic Regression. (weighted avg F1 score = 0.8818)
- After using synthetic data, the best performance model is BERT. (weighted avg F1 score = 0.9362)
- All model improved their performances significantly after integrating with the synthetic data, especially the BERT model.
- Why? Ensures text is clean and standard across all data points.
- Justification: Text preprocessing removes irrelevant information and highlights meaningful patterns for downstream tasks.
- TF-IDF
- A simple but effective approach for text embedding, works well on tasks primarily rely on keyword matching.
- BERT
- Generates embeddings for each word of the text, understands the context of the words well.
- SBERT
- Captures rich semantic relationships between sentences.
- Logistic Regression
- A fundamental classification approach.
- Random Forest
- A tree-based ensemble model that works well and efficiently for many use cases.
- BERT
- Often the STOA model for many NLP tasks, but require careful fine-tuning. In this excise I used QLoRA to tune the attention layers of BERT on a single GPU (Google Colab T4).
- Train and Test Data
- I split the
processed-datausingtrain_test_splitfunction insklearn, withrandom_state=123to ensure the test set is fixed. I also use stratified splitting to ensure the target variable has the similar distribution in both train and test dataset.
- I split the
- Model Pipeline
- I used
sklearn Pipelineto integrateTextPreprocessor,embedding_modelandclassification_modelinto a single piece. This design enhances the consistency and reproducibility in both training and evaluation stages.
- I used
- Why? To improve the interpretability of the model, the visualization tool offers the following functionality:
- Sketch the performance on the test dataset.
- Visualize the relation between the feature and label for the whole processed data.
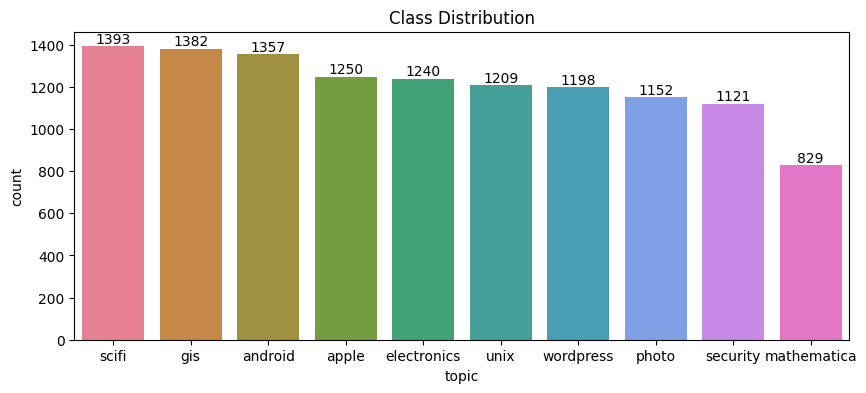
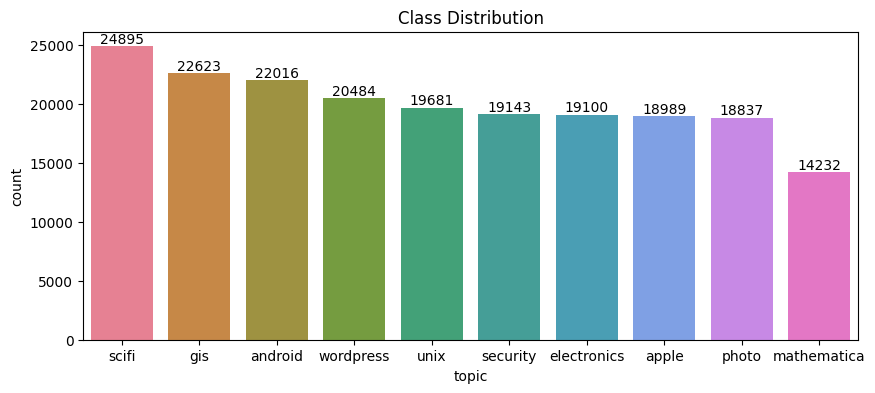
In the EDA part, we visualize basic statistics of the features in both the original training data and the synthetic data (200K rows). We also compare the feature statistics between the two dataset.
As shown in the figures below, both the original data and the synthetic data has similar topic distribution pattern -
sci-fi is the hottest topic and mathematics is the least popular topic. Also in both dataset, apple, electronics,
unix, wordpress,photo, security are evenly distributed, although the total contribution to each topic varies slightly
between the original and the synthetic data.
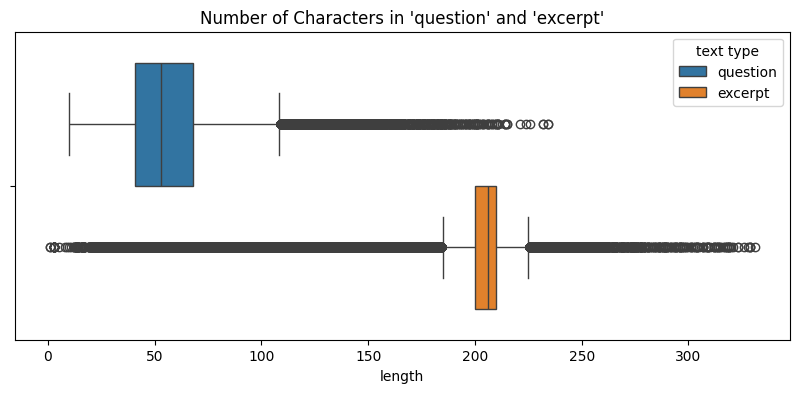
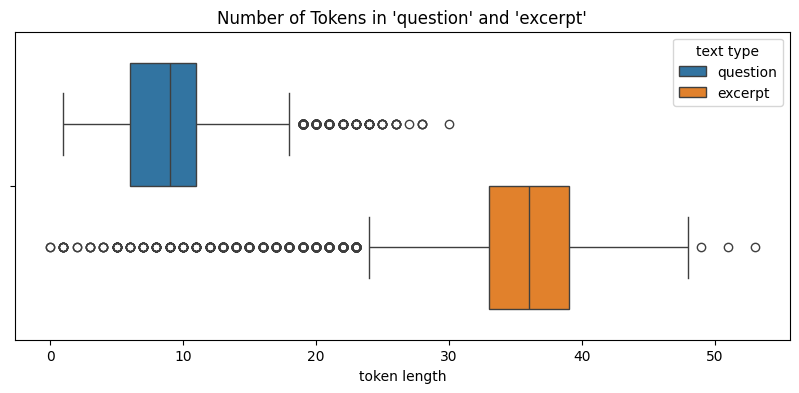
Since all the features in the data are texts, we measure 1. distribution of number of characters (text length) for each feature and 2. distribution of number of tokens for each feature.
Let's first check the text length for both data using box plots:
We see that although both data have outliers, the median lengths for `excerpt` are around 200 - 4 times of `question` length. This indicates that the original data and the synthetic data has similar feature length distributions.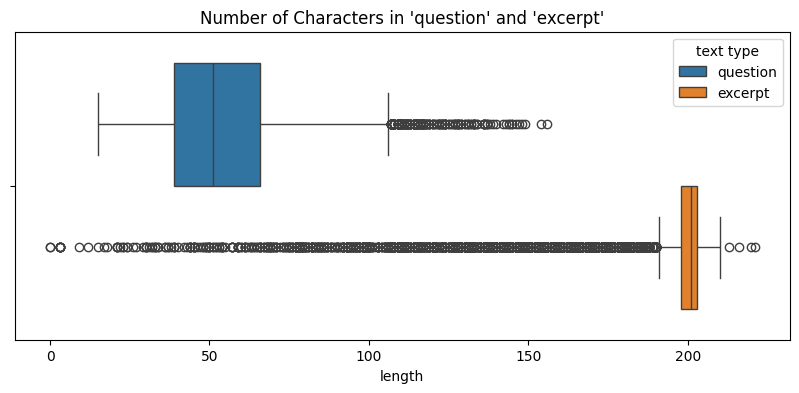
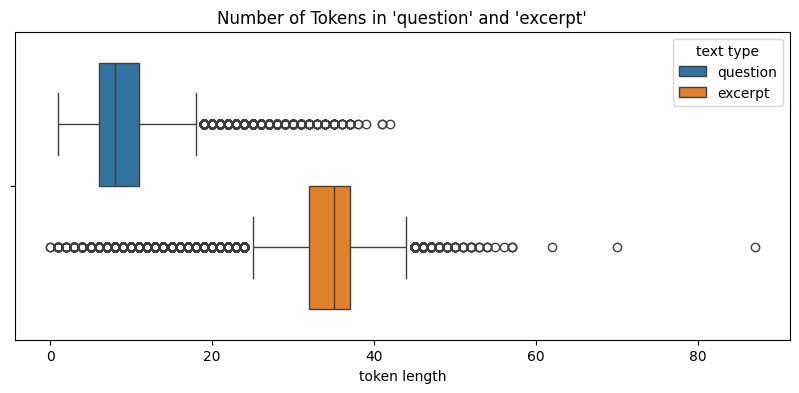
Likewise, we can see that the distributions of number of tokens between the two data are similar.
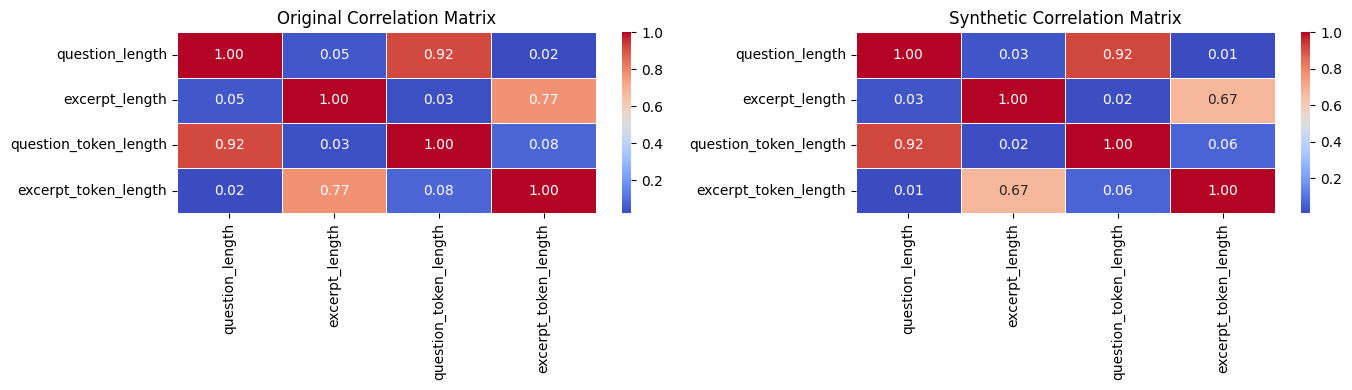
Finally, we plot the inter-feature correlation matrices for both the original data (left) and the synthetic data (right).
While both data have similar correlation heatmap pattern, the question length has nearly no correlation with excerpt length.
This indicates that the question feature maybe completely independent of the excerpt feature. Since in this solution,
we made the decision to concat question and excerpt, there is a potential to improve the model performance if we treat
these features separately.
We compared the performance of different methods using the original training data (processed-data). We use weighted average precision, recall and F1 score as the evaluation metrics. It turns out that model with TF-IDF embedding and Logistic Regression classification has the best performance.
| Model (embedding + classifier) | Precision | Recall | F1 |
|---|---|---|---|
| TF-IDF + Logistic Regression | 0.8828 | 0.8826 | 0.8818 |
| TF-IDF + Random Forest | 0.8256 | 0.8245 | 0.8232 |
| Sentence BERT + Logistic Regression | 0.8704 | 0.8702 | 0.8702 |
| Sentence BERT + Random Forest | 0.7789 | 0.7738 | 0.7685 |
| BERT + BERT | 0.6974 | 0.7058 | 0.6805 |
We use the 200K rows of synthetic data on top of the original train data to retrain the models again (with test data being fixed). To illustrate the effect of training data size on model performances, we show experimental results for two sizes of synthetic data. The performance metrics are listed as follows.
| Model (embedding + classifier) | Precision | Recall | F1 |
|---|---|---|---|
| TF-IDF + Logistic Regression | 0.9115 | 0.9102 | 0.9102 |
| TF-IDF + Random Forest | 0.8761 | 0.8747 | 0.8735 |
| Sentence BERT + Logistic Regression | 0.8801 | 0.8793 | 0.8794 |
| Sentence BERT + Random Forest | 0.8181 | 0.8179 | 0.8158 |
| BERT + BERT | 0.9366 | 0.9361 | 0.9362 |
We can see that with more training data available, all models improved significantly. Especially, the BERT model now outperforms all the other models.
- Before using synthetic data, the best performance model is TF-IDF + Logistic Regression. This was because
- Feature dimension. I specified 5000 dimension using TF-IDF embedding (sparse representation), while BERT/SBERT use 768-dimension of dense vector representation.
- Logistic regression works well with sparse and linear features that TF-IDF produced. Random Forest works better on nonlinear features.
- BERT model requires large training data for fine-tuning to get better results.
- Over fitting may happen for more advanced models.
- After using synthetic data, the best performance model is BERT. This was because
- BERT is a pre-trained model that has been trained on a large corpus of text. It has state-of-the-art performance.
- After fine-tuning with large training dataset, the performance will improve significantly.
- All model improved their performances after integrating with the synthetic data. With more synthetic data available, the model performance will be improved further.
- The UMAP plots reveal distinct clusters for all the topics, validating the separability of embeddings.
We visualize the test results using the following plots:
- Distribution of the prediction confidence scores;
- Embeddings of each data point by topics, using UMAP dimension reduction.
Where a prediction confidence score is the largest predicted probability from the model across all the topics.
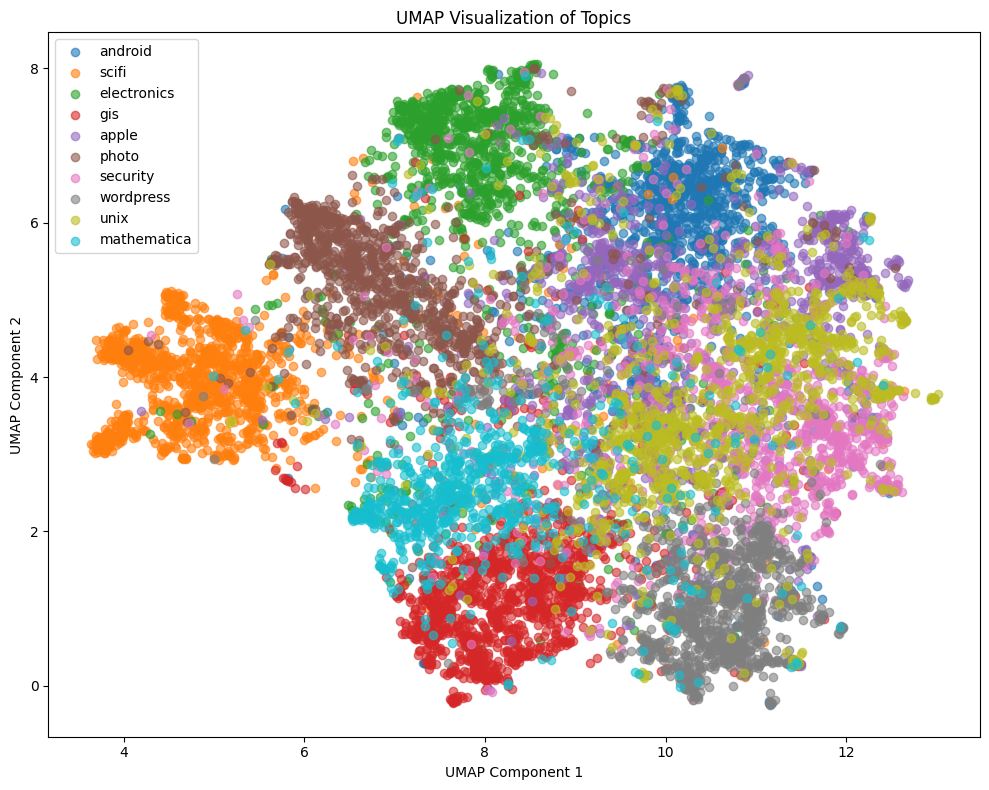
First, we start with the TF-IDF + LR model trained with additional synthetic data.
We see that although this model achieves a weighted avg F1 score at 0.9102, the confidence score distribution is a bit "flat", or heavy tailed. Also, from the embedding plot, although different topics form distinct clusters, the edges among those clusters are often vague. The observations above indicates that although this model performs well, it's only able to learn a rough relation between the features and the topic.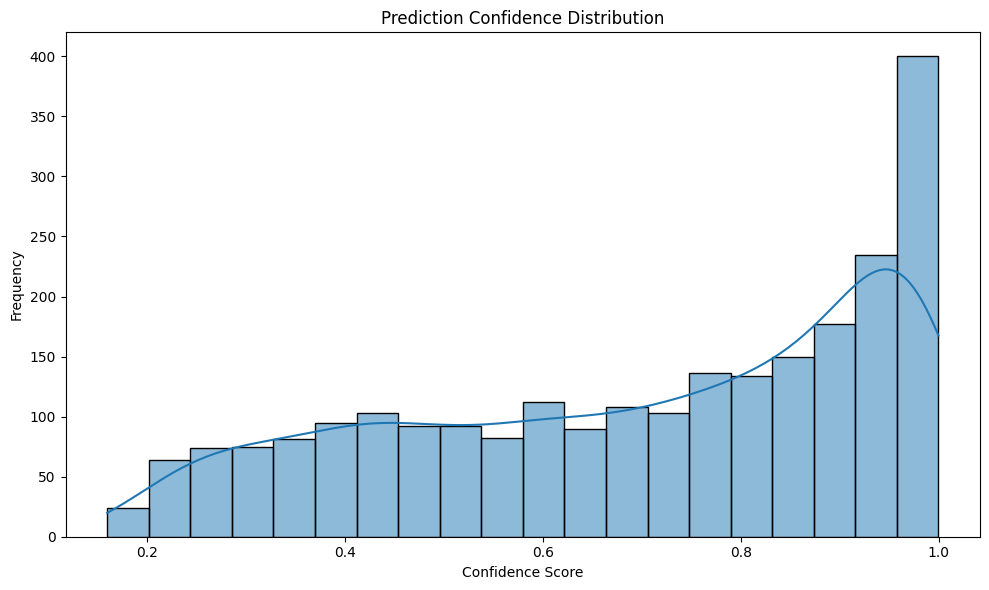
Next, we check the BERT model, fine-tuned without using synthetic data.
This was the worst performing model among all (although with hyperparameter tuning, we can further improve it). This can be cross-validated by its confidence score plot - most of the confidence scores are smaller than 0.5. However, its embedding plot is very different from the TF-IDF + LR model - although most of the topics are inseparable from each other, topic "scifi" and "photo" form clear independent clusters. From the classification report, we can also see that "photo" and "scifi" has much higher F1 scores (0.94 and 0.98 respectively) than the other topics. This means that the original BERT classifiler was able to learn meaningful patterns from "scifi" and "photo" topics.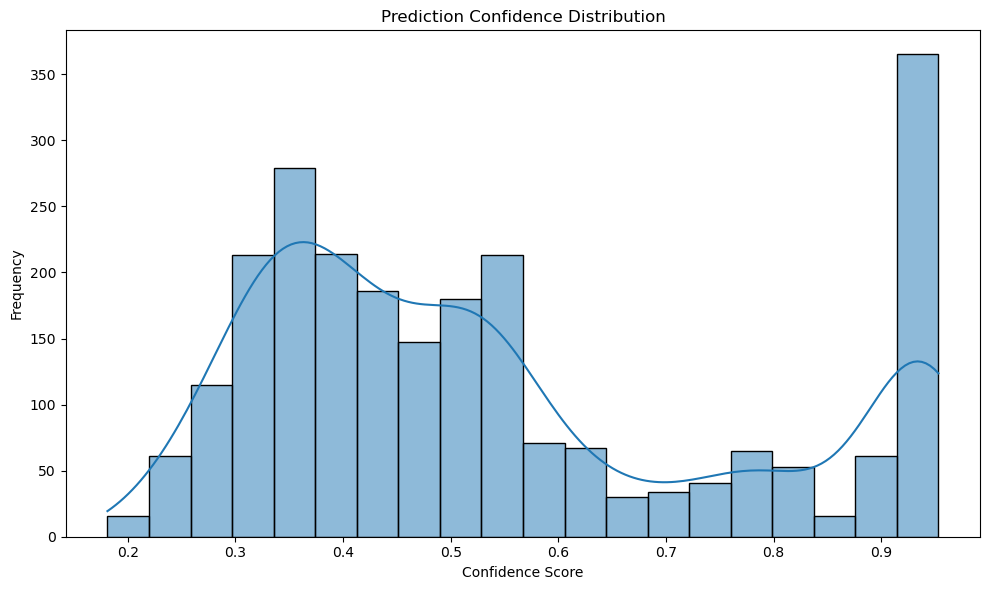
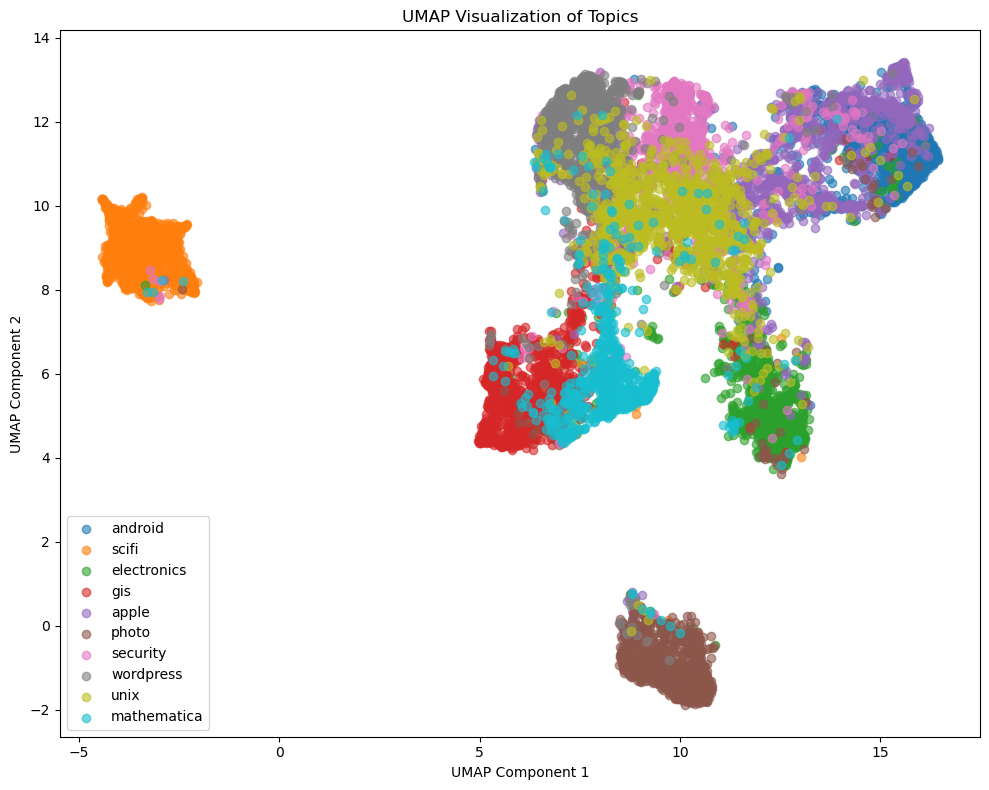
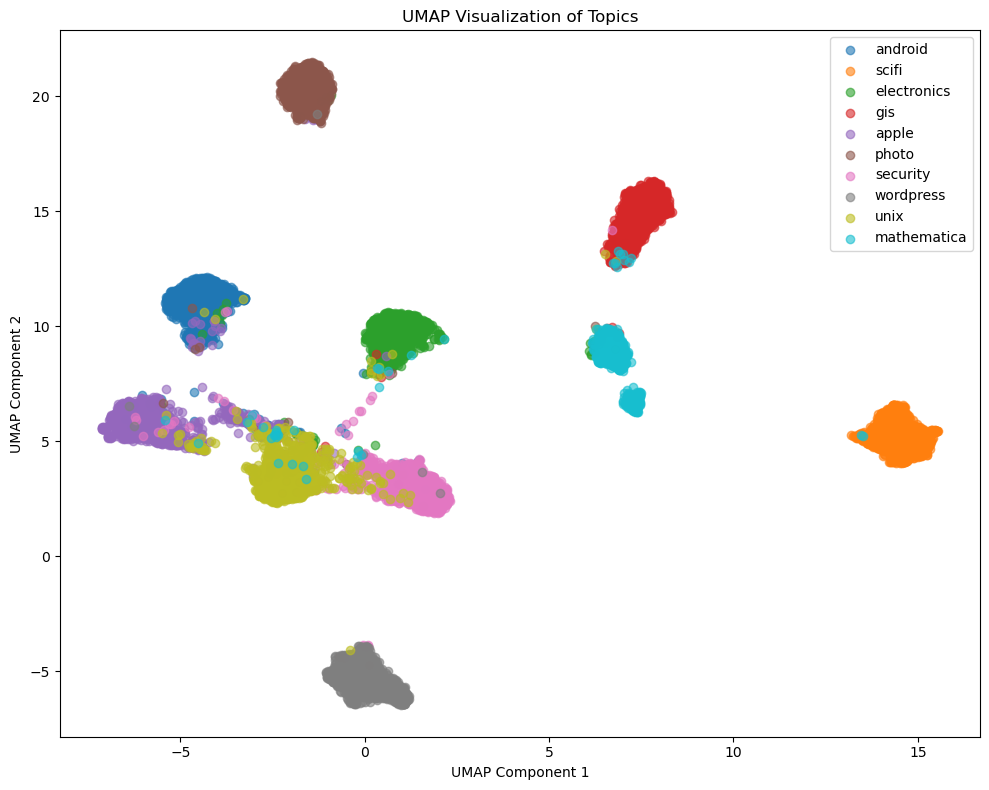
Finally, we check the BERT model which was fined-tuned with synthetic data.
With more training data been available, the confidence scores are high (>0.9) for most of the data. Also, the embedding plot was able to separate all the topics much better, compared to the previous two models. Since there are still inseparable points between "gis" and "unix", as the next step, we can use techniques like upper sampling on these two topics to further improve the model performance.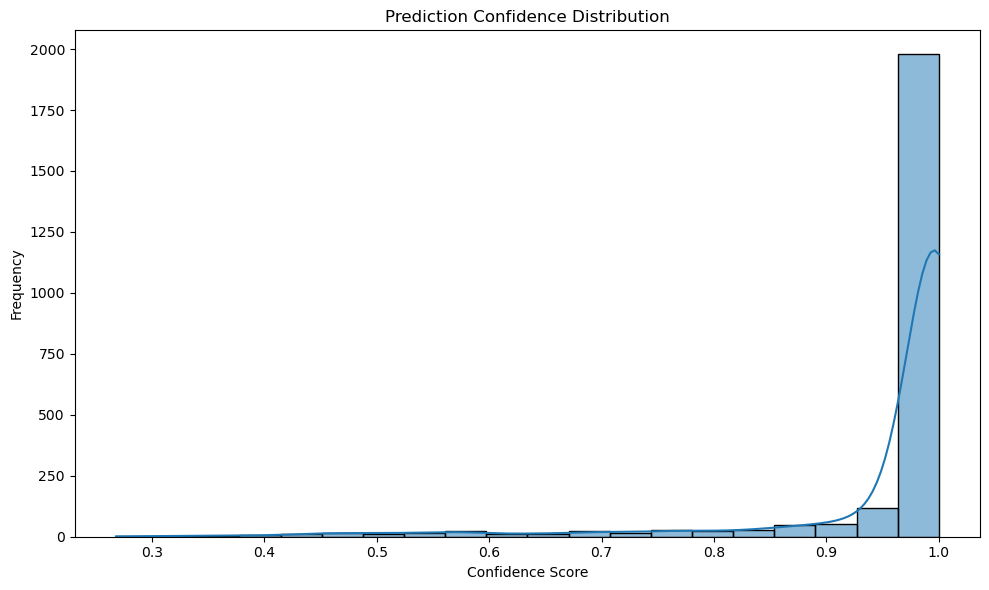
- Treat the two features (
question,exerpt) separately instead of combining them together. - Combine TF-IDF with SBERT embeddings to leverage both sparse and dense text embeddings.
- Experiment with other classifiers like XGBoost and neural networks to enhance performance.
- Tuning both the embedding and the classification models.
- Using grid search, random search or Bayesian optimization for hyperparamenter tuning.
- Add learning rate scheduler for the BERT model.
- In this exercise I only generated 200K rows of synthetic data (using more data would significantly increase BERT model training time). If more synthetic data are available, the model performance will be further improved, especially the BERT model,