An ESP32-based office monitoring system that logs temperature, humidity and occupancy (via WiFi device counting) into a Google Sheet — complete with self-healing firmware, on-device crash forensics, and a physiological heartbeat LED that "pants" under CPU load. 💓
The name and use case come from real life: we originally set this up to monitor the DecentLabs office climate during a hot summer when the air conditioning had some weaknesses. It has since evolved from a Raspberry Pi + Python script into a full-featured ESP32 telemetry platform. (The original RPi version is preserved at the bottom of this README as legacy.)
Code by: Róbert Szalóki, Hardware configuration, ESP32 port and manual by: Zoltan Dóczi (RFsparkling), Licensed by DecentLabs

Phyisiologycal hearth beat activity, mimicing humany boday with artifical HRV and randomness, also CPU load dependent BPM
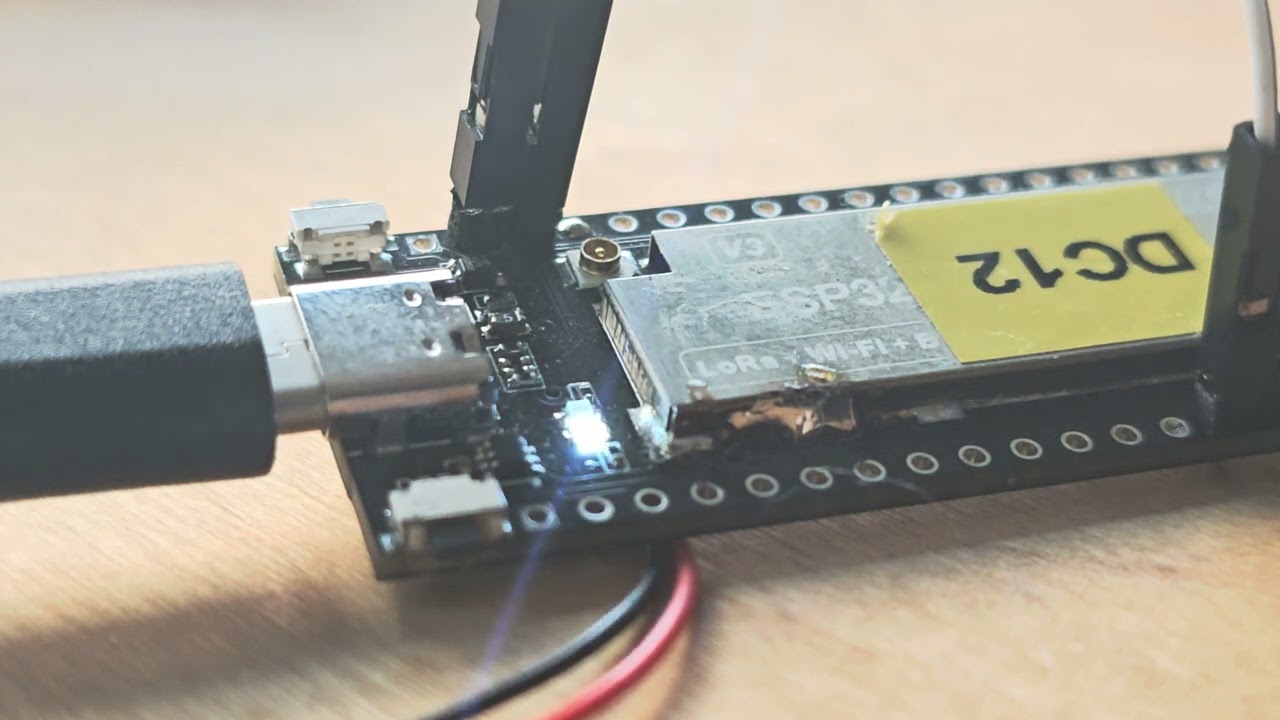

 ,
,

- WiFi device counting as an occupancy proxy — low-level ARP sweep of the /24 subnet using raw lwIP
etharpcalls (no ping, so firewalled phones answer too) - 4-pass multi-sweep scan with result union — defeats WiFi frame loss and catches power-saving mobile clients that miss single-pass scans; accuracy matches an
nmap -snreference within ±1 device, at half the scan time (~18 s on a 240 MHz MCU) - Thread-safe lwIP access — all ARP calls wrapped in the TCP/IP core lock, eliminating a race condition that otherwise causes random freezes after hours of operation
- SHT21 temperature & humidity logging every 10 minutes
- Battery voltage telemetry via the Heltec V3 onboard divider
- RAM FIFO buffer (24 h deep) — measurements survive network outages and upload in order once connectivity returns
- ACK-based, idempotent upload to Google Sheets — entries are only dropped from the buffer after a confirmed write; the Apps Script backend deduplicates re-sent measurements by timestamp, so a lost ACK can never cause data loss, duplicates, or retry storms
- Explicit TLS/HTTP timeouts — a stuck connection can never block the firmware forever
- Manual measurement button — the USER button triggers an immediate measure + upload cycle
- Hardware task watchdog (90 s) with automatic recovery restart
- Reset-reason tracking — every boot logs why the previous run ended (
POWERON,TASK_WDT,PANIC,BROWNOUT,SW...), with lifetime counters persisted in NVS flash - RTC-memory breadcrumbs — after a crash, the firmware knows which phase it died in (sensor read, scan pass N, TLS handshake, ...)
- Core dump harvesting — panic PC + backtrace addresses are read back from flash on reboot and reported; decode them offline with
addr2line - Reboot-storm-proof reporting — un-uploaded forensics chain up in NVS and ship with the first successful upload; the device effectively writes its own incident reports into the log
- Health telemetry in every row — free heap, largest allocatable block (fragmentation early-warning), uptime, boot/watchdog counters
- Physiological heart model on the onboard LED: lub-dub double beat, respiratory sinus arrhythmia, beat-to-beat HRV jitter, and HRV narrowing under load — just like a real heart
- CPU-load-driven BPM — resting ~50 BPM when idle, ramping toward 160 BPM during the TLS crypto sprint, with asymmetric ramp-up/cool-down kinetics (fast sprint, slow athletic recovery)
- Honest CPU measurement — an IRAM-safe FreeRTOS tick-hook sampling profiler (1 kHz), immune to WiFi-interrupt artifacts; runs in its own FreeRTOS task, so the heart keeps beating even while the main thread blocks
- 12-bit gamma-corrected PWM — perceptually smooth breathing instead of stepped dimming
- MAC anonymization switch (on by default) — UART logs show
AA:BB:CC:XX:XX:XX, keeping the vendor OUI visible for debugging while masking device identities; safe for screen recordings and published logs
| Component | Detail |
|---|---|
| Board | Heltec WiFi LoRa 32 V3 (ESP32-S3) |
| Sensor | SHT21 (I2C temperature + humidity) |
| I2C pins | SDA: GPIO 41, SCL: GPIO 42 (custom mapping for clean prototyping) |
| Sensor rail | switched via the onboard Vext power switch (GPIO 36) |
| Battery | optional 18650 cell, charged over USB; voltage read via onboard divider (GPIO 1 / GPIO 37) |
| Button | onboard USER/PRG button (GPIO 0) — manual measurement trigger |
| LED | onboard LED (GPIO 35) — the heart ❤️ |
⚠️ Power supply note: USB-PD chargers (e.g. the Raspberry Pi 5 supply) may refuse to deliver power without PD negotiation — use a plain 5V USB supply. We learned this the hard way; the battery-voltage telemetry column exists because of it. :)
esp32_version/
├── platformio.ini   # Project configuration, dependencies, board definition
└── src/
    └── main.cpp     # Firmware (scanner, buffer, forensics, heartbeat LED)
code.gs              # Google Apps Script backend (idempotent ingestion endpoint)
uptime_dashboard.gs  # Optional: date × hour uptime heatmap generator
One-click template: make your own copy of the pre-configured sheet (the attached Apps Script comes with it):
👉 Copy the officeAir template sheet
Or build it manually: create a spreadsheet with a tab named Raw and this header row:
time | temperature | humidity | buffer | devices | heap | maxblock | uptime | boots | wdt | rr | vbat | crash
Column mapping is header-driven: the script matches incoming URL parameters to column names, so you can reorder columns or add new telemetry fields later without touching the code.
Then deploy your own endpoint (deployments are not copied with the template — everyone needs their own):
- Open Extensions → Apps Script (paste
code.gsif you built the sheet manually) - Deploy → New deployment → Web app
- Execute as: Me | Who has access: Anyone
- Authorize when prompted, then copy the Web app URL (
https://script.google.com/macros/s/.../exec)
💡 After any future script edit: Deploy → Manage deployments → New version — saving alone does not go live!
Column meanings, beyond the sensor readings: devices is the ARP scan result (-1 = scan skipped), heap/maxblock track memory health (a shrinking maxblock reveals heap fragmentation long before it bites), uptime drops to zero on silent reboots, boots/wdt are lifetime restart counters, rr names the reset reason that started the current run, vbat is the cell voltage, and crash holds the post-mortem of any abnormal restart — phase, program counter and backtrace, chained across reboot storms. The device writes its own incident reports.
- Open
esp32_version/in VS Code + PlatformIO - Edit the configuration block at the top of the source:
ssid/password— your WiFi credentialsgoogleScriptUrl— the Web app URL from step 1ANONYMIZE_MACS— leavetrueunless you want full MACs in the UART log
- Upload. Keep the built
firmware.elf(.pio/build/<env>/firmware.elf) — you'll need it to decode backtrace addresses if a crash report ever lands in thecrashcolumn:xtensa-esp32s3-elf-addr2line -pfiaC -e firmware.elf 0x4200....
Paste uptime_dashboard.gs into the same Apps Script project and add a time-driven trigger (e.g. every 10 minutes) for generateUptimeDashboard. It renders a date × hour heatmap of measurement delivery on a separate tab. Pair it with a conditional-formatting color scale — Minpoint: Number 0, Midpoint: Number 90, Maxpoint: Number 100. Future hours are left empty by the script, so they're never painted as false downtime.
Temperature and humidity charts over several days:


Current consumption profile measured on an Otii Arc:


| Feature | Legacy (Raspberry Pi) | Current (ESP32) |
|---|---|---|
| Hardware | Raspberry Pi (SBC) | ESP32-S3 (Heltec WiFi LoRa 32 V3) |
| Language | Python + Bash + cron | C++ (Arduino / PlatformIO) |
| Sensing | Temperature + humidity | Temp + humidity + occupancy (ARP device counting) + battery |
| Reliability | Fire-and-forget curl |
Buffered, ACK-based, idempotent pipeline + watchdog + crash forensics |
| Power | ~2–5 W, always-on | ~0.4 W always-on (mains); a deep-sleep variant (µA-range standby) exists for battery/solar use |
| HTTP | curl -L |
HTTPClient with strict redirect following (Apps Script 302s handled natively) |
| Form factor | Large, needs a solid 5 V supply | Compact, USB-powered, battery/solar friendly |
The original project — kept here for reference and for existing installations. New setups should use the ESP32 version above.
You can take this example Google sheet (make a copy and format to your needs): example google RPi sheet
Raw data looks like this:


You can also download the script from the repo

3. Copy the web app link — it will be pasted into the Raspberry Pi script in step 8. This key links the RPi to your Google Sheet:

sudo raspi-config


sudo apt update
sudo apt upgrade
sudo apt install i2c-tools
sudo i2cdump -y 1 64
It should look something like this:

sudo mkdir /usr/local/bin/log
cd /usr/local/bin/log
sudo nano log
#/bins/sh
DATA=`sht21.py`
curl -L "https://script.google.com/macros/s/**your web app key here**/exec?$DATA"
sudo chmod +x log
cd /usr/local/bin/
sudo wget https://raw.githubusercontent.com/DecentLabs/officeAir/master/sht21.py
sudo chmod +x sht21.py
sudo nano /etc/crontab
Append as the last line:
* * * * * root /usr/local/bin/log/log #log air quality
Finally, reboot the RPi — once it comes back it will report temperature and humidity to the Google Sheet every minute:
sudo reboot