
An advanced atmospheric intelligence platform using NASA data (1994–2021), Stochastic Machine Learning, and Real-Time Telemetry.







N.O.V.A. (North American Ozone Visual Analytics) is a Mission Control–style atmospheric intelligence system designed to analyze, visualize, and predict stratospheric and tropospheric Ozone (O₃) concentrations across Western North America.
It transforms nearly 30 years of NASA atmospheric back-trajectory data into an interactive desktop dashboard combining:
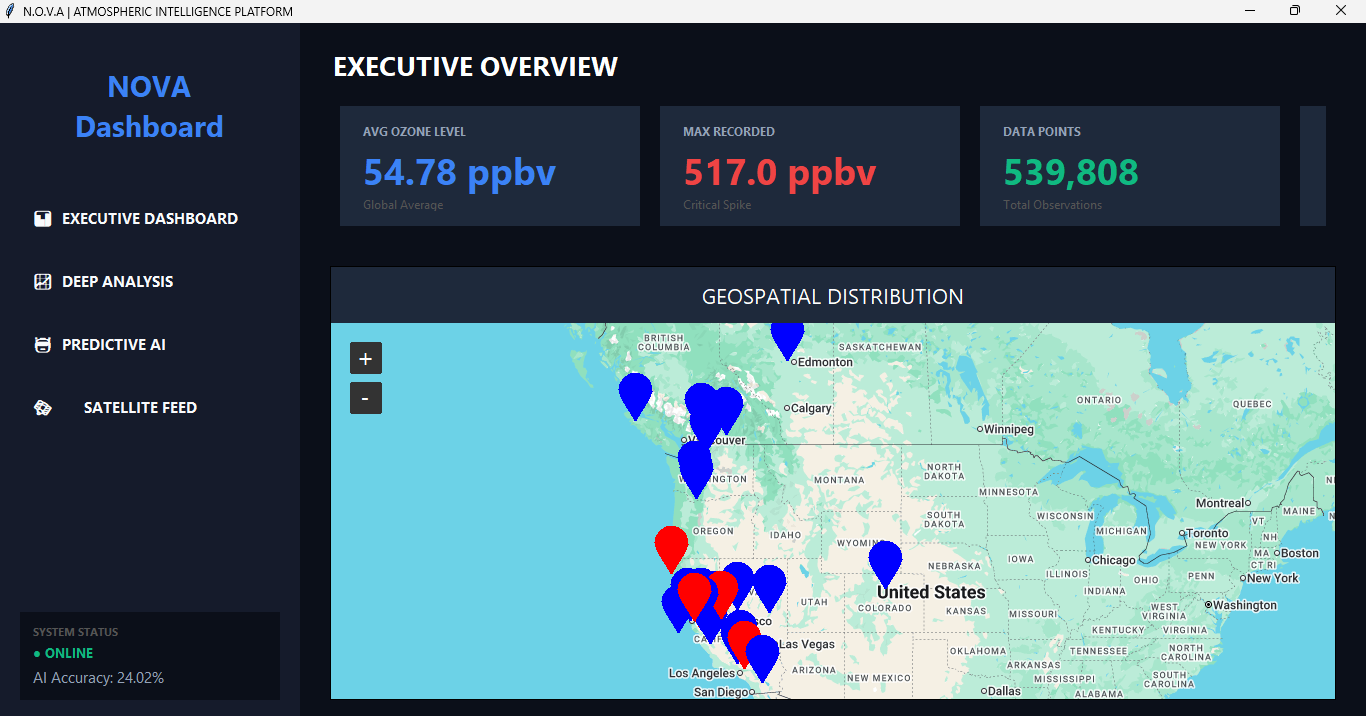
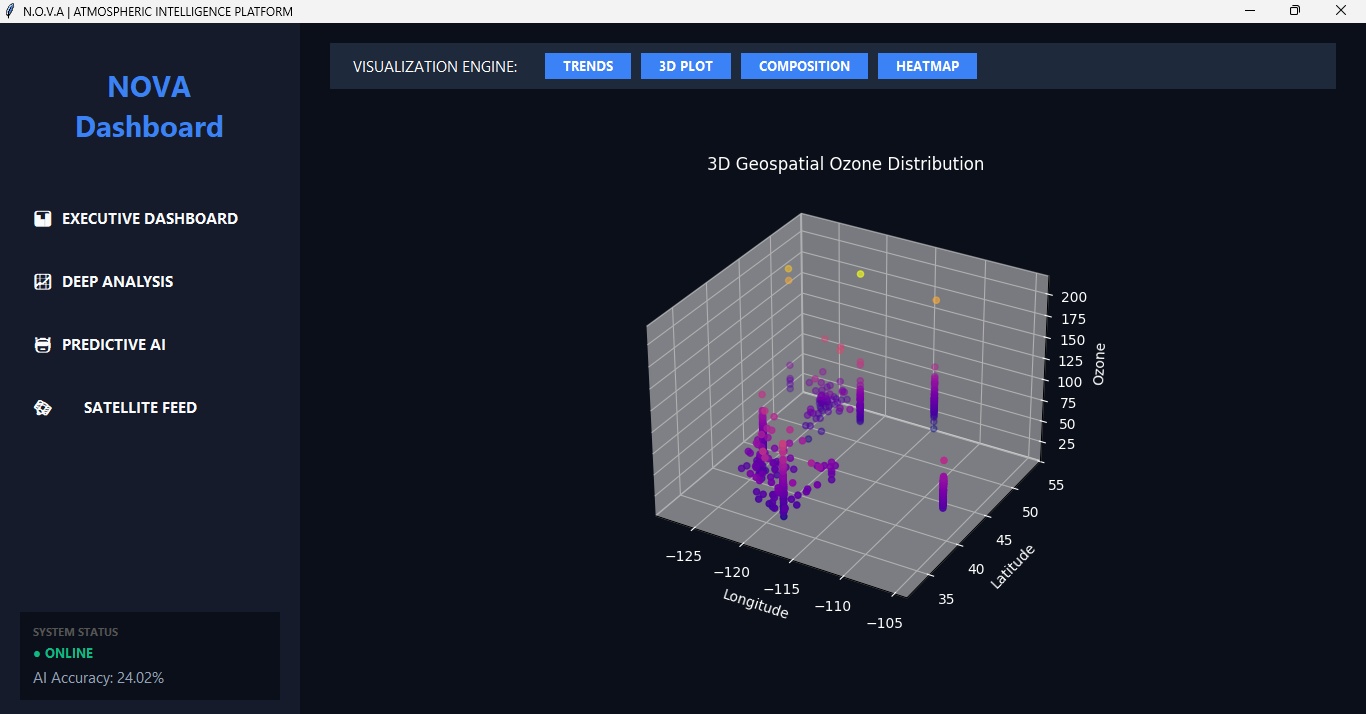
- 📊 Historical Geospatial Visualization
- 🤖 Random Forest Machine Learning Prediction
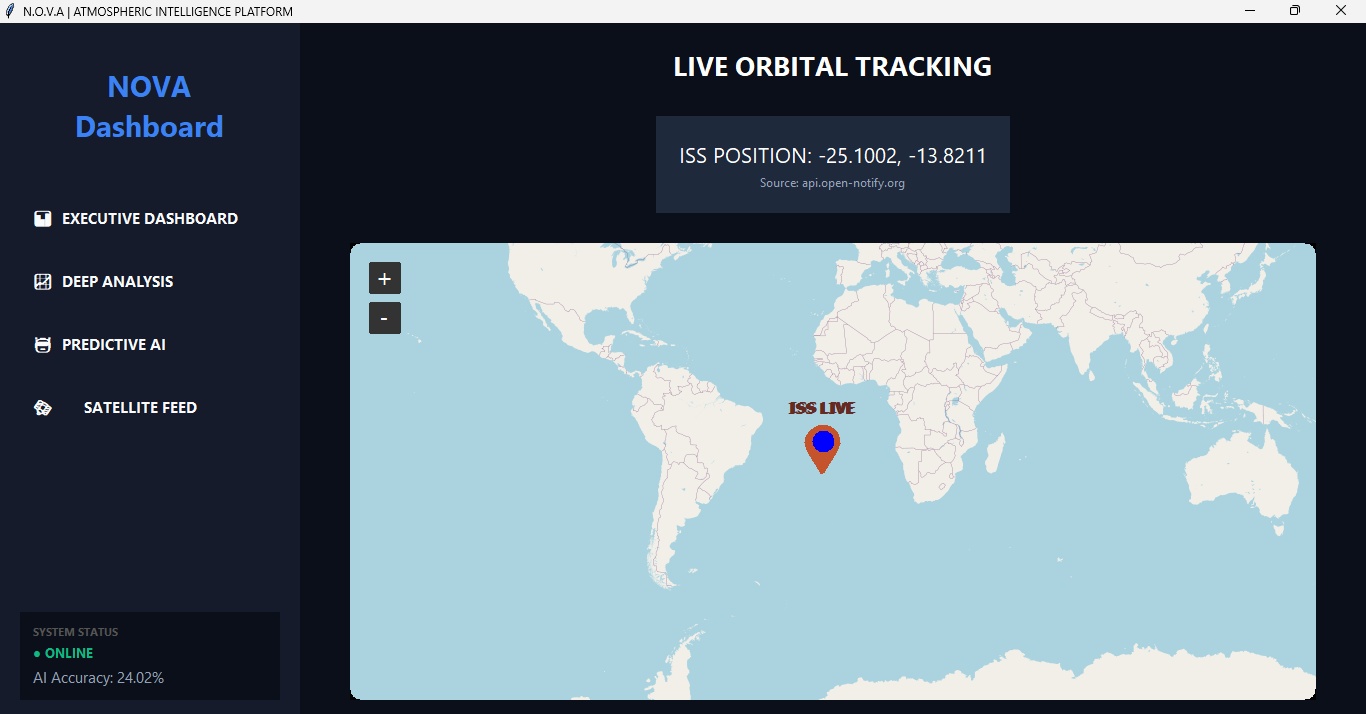
- 🛰️ Real-Time ISS Telemetry Tracking
| Feature | Description |
|---|---|
| 🌌 3D Geospatial Visualization | Interactive 3D atmospheric ozone distribution |
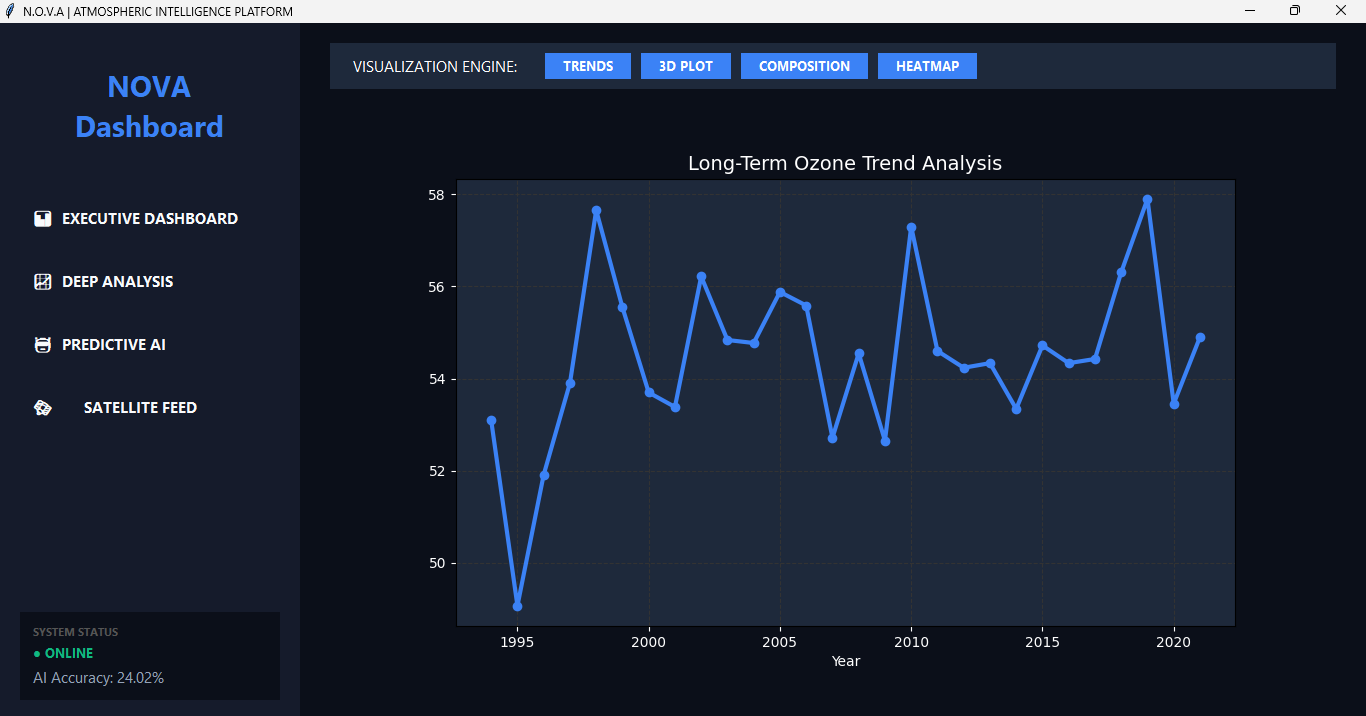
| 📈 Trend Analysis | Historical line graph and seasonal analysis |
| 🤖 AI Prediction Engine | 50-tree Random Forest Regressor |
| 🛰️ Live ISS Tracker | Real-time satellite telemetry via API |
| 🎛️ Mission Control UI | Dark cyber-corporate themed interface |
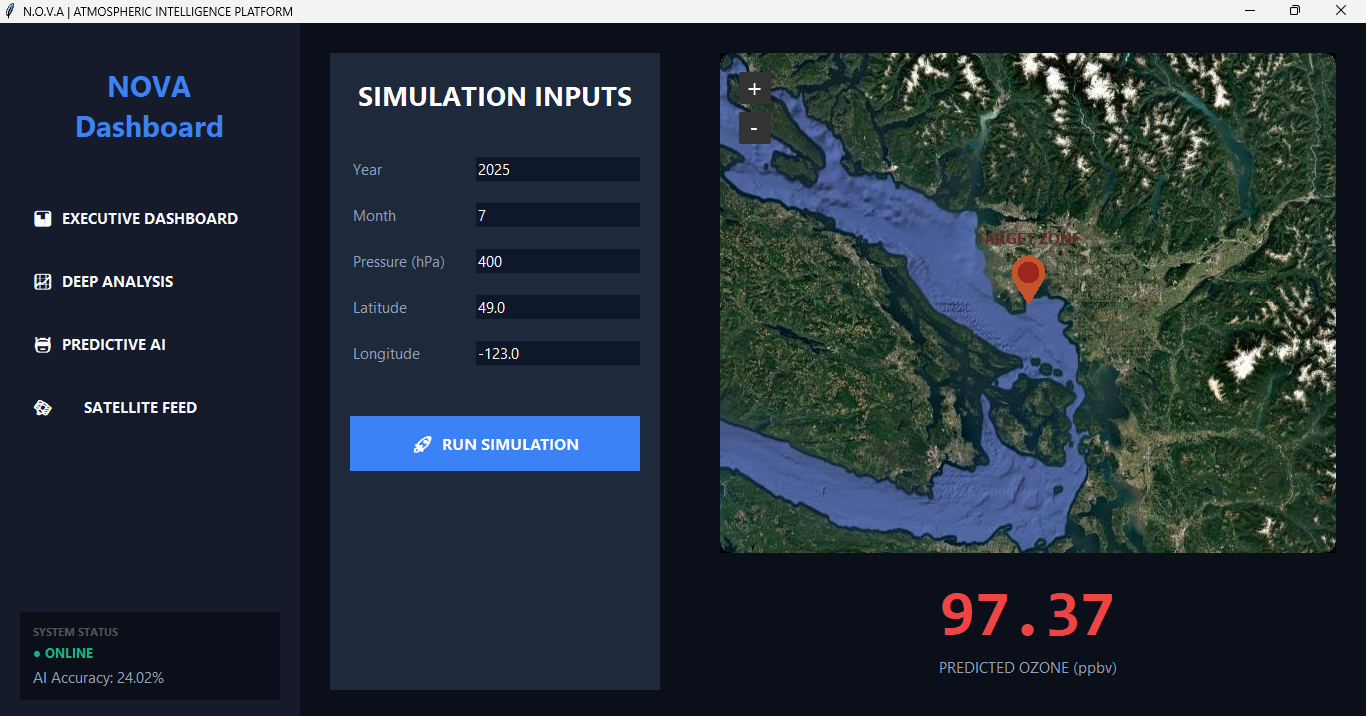
- Pressure (hPa) — Represents altitude
- Latitude
- Longitude
- Month
- Year
- Ozone Concentration (ppbv)
- Algorithm: Random Forest Regressor
- Trees: 50 (
n_estimators=50) - Train/Test Split: 80/20
- Typical R² Score: 0.85 – 0.94
- Most Influential Feature: Pressure (Altitude)
Random Forest was selected because atmospheric ozone behavior is non-linear and seasonal, making linear regression insufficient.
The ISS tracking system:
- Fetches live coordinates from a public API
- Updates every 3 seconds
- Runs in a background thread
- Prevents UI freezing using multithreading
N.O.V.A. follows the Model–View–Controller (MVC) pattern:
| Layer | Role |
|---|---|
| Model | Data processing & AI engine |
| View | Tkinter GUI interface |
| Controller | User-triggered simulation & visualization logic |
git clone https://github.com/arshc0der/N.O.V.A-Geospatial-Ozone-Predictor.git
cd N.O.V.A-Geospatial-Ozone-Predictorpython -m venv venvvenv\Scripts\activatesource venv/bin/activatepip install -r requirements.txtPlace this file in the root directory:
Receptor_western_NAmerica_ozone_obs_1994_2021_from900to300.csv
python app.pypandas
numpy
scikit-learn
matplotlib
seaborn
requests
tkintermapview
- Fork the repository
- Create a feature branch
- Commit changes
- Submit a Pull Request
Distributed under the MIT License. © 2026 Arsh