A demo showcasing the FacioQuo.Stock.Indicators NuGet package with a React frontend, Chart.js charting, and a .NET Web API backend for financial indicators. See the library documentation for more examples, guides, and available indicators.
Live demo: charts.StockIndicators.dev
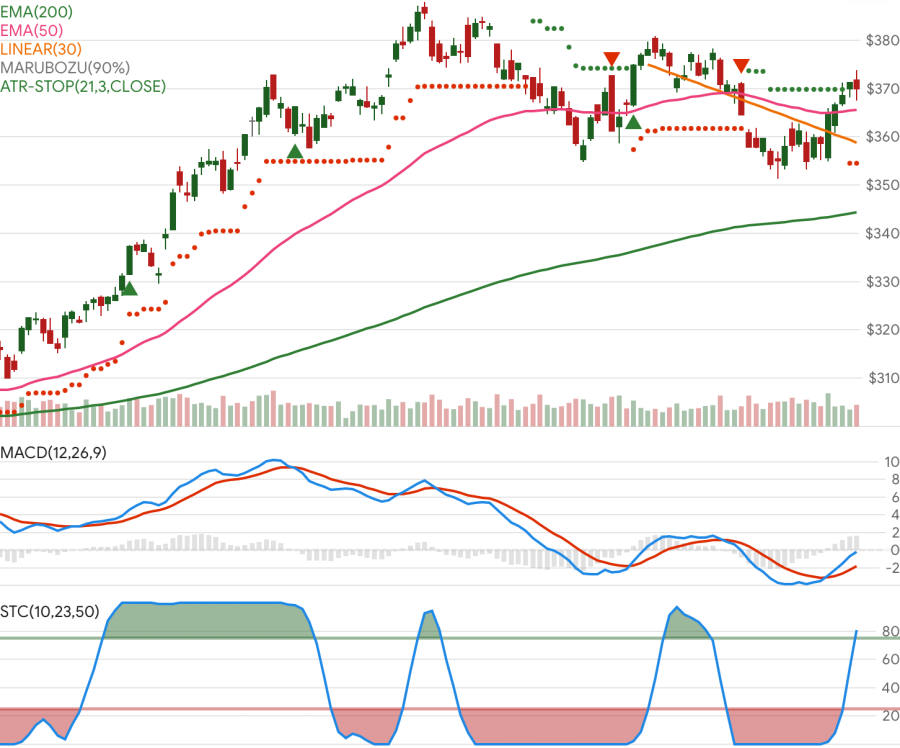
This repo and charting tool is primarily intended to demonstrate the Stock Indicators for .NET library. It is not meant to be a fully featured charting system and may not be an architectural model that works for your use case. If you need a mature charting tool, please explore all of your charting and visualization options.
All platforms:
- Git
- Node.js (v24 LTS or later)
- pnpm (v11 or later) - Installed via platform package managers:
- macOS: Homebrew (
brew install pnpm) - Windows: winget (
winget install pnpm.pnpm) - Linux: Corepack (
corepack enable && corepack prepare pnpm --activate)
- macOS: Homebrew (
- .NET SDK (v10.0 or later)
- Visual Studio Code (recommended) or Visual Studio
- Docker - optional, only to run the API in its deployment container via
pnpm run edge:dev
After installing the prerequisites above, run pnpm install from the repository root.
# Clone and install
git clone https://github.com/facioquo/stock-charts.git
cd stock-charts
pnpm install

# Start development environment
# Option 1: Use VS Code
# Ctrl+Shift+P → "Tasks: Run Task" → "Run: Full development stack"

# Option 2: Manual start in separate terminals
cd server/WebApi && dotnet run  # Terminal 1: Web API
pnpm start  # Terminal 2: React dev server (Vite)
Access: Website at http://localhost:4200, Web API at https://localhost:5001
No storage emulator or cloud credentials are needed: without a reachable quote host the API serves a bundled backup dataset, so charts render on a fresh clone.
To exercise the API exactly as it is deployed — inside its container, behind the caching/CORS
Worker — run pnpm run edge:dev (requires Docker) and point the site at http://localhost:8787
with VITE_API_URL. See server/edge/README.md.
Financial chart support (candlestick, ohlc, volume) is integrated as typed, modular Chart.js workspace packages under libs/chartjs-financial and libs/indy-charts.
- Register once at startup with
setupIndyCharts()(already called fromweb/src/main.tsx). - Use OHLC data points in
{ x, o, h, l, c }shape wherexis a timestamp. - Theme candle/volume colors via
getFinancialPalette()+applyFinancialElementTheme(). - Use factories (
buildCandlestickDataset,buildVolumeDataset,buildFinancialChartOptions) for consistent typed chart config. - For large datasets (5k-10k candles), prefer
animation: false, keep tooltip interaction non-intersecting, and avoid unnecessary redraws.
This integration is derived from chartjs-chart-financial and keeps upstream license attribution in source headers.
For AI coding agents (GitHub Copilot, Claude, etc.), see AGENTS.md for comprehensive project context including:
- Primary and secondary directives
- Repository structure with permissions
- Commands and code style patterns
- Technology conventions and boundaries
- Development workflow
For detailed development setup, testing, linting, formatting, and contribution workflow, see the contributing guidelines.
This project is licensed under the Apache 2.0 License - see LICENSE for details.