![]()

- Name: rpi_tempmon
- Title: Display the ARM CPU and GPU temperature of Raspberry Pi
- Description:
This Python program displays the ARM CPU and GPU temperature of a Raspberry Pi. Features include command line display, GPIO (LED) output, logging, alarm limit, graphing, desktop notification, stress tests and email options. It runs in a terminal and uses matplotlib plots for graph modes.
- Author: Gavin Lyons
- URL: https://github.com/gavinlyonsrepo/raspberrypi_tempmon
- Tested on:
- RPI 3 model B. Raspbian 10 Buster, 32 bit. Python 3.7.3.
- RPI 3 model B. Raspbian 12 Bookworm, 64 bit. Python 3.11.2.
- RPI 5 Raspbian 12 Bookworm, 64 bit. Python 3.11.2.
PyPI — pip or pipx
# Core install (terminal and logging modes)
pip install rpi-tempmon

# With graph and stress-test support
pip install rpi-tempmon[graphs]
Manually install from GitHub
curl -sL https://github.com/gavinlyonsrepo/raspberrypi_tempmon/archive/3.1.1.tar.gz | tar xz
cd raspberrypi_tempmon-3.1.1
pip install .Run from a terminal:
rpi-tempmon -[option] [argument]Options list (options are stand alone, not designed to be combined):
| Option | Description |
|---|---|
| -h | Print help information and exit |
| -v | Print version information and exit |
| -c | Continuous mode — integer argument sets delay in seconds e.g. -c 5 |
| -l | Log to file — creates/appends log.txt in output folder |
| -L | Log to folder — creates a timestamped sub-folder with a log file |
| -m | Mail mode — sends log.txt to configured email address |
| -g | Graph mode — menu of 12 graph types (requires [graphs] extra) |
| -a | Data mode — parses log file and produces a report in terminal |
| -n | Notify mode — desktop notification, integer argument sets behaviour |
| -s | CSV mode — converts log.txt to log.csv |
| -ST | Stress test — integer argument sets number of runs e.g. -ST 5 |
| File Path | Description |
|---|---|
| rpi_tempmon/rpi_tempmon.py | Main entry point |
| rpi_tempmon/sensors.py | Hardware metric reading |
| rpi_tempmon/models.py | SystemSnapshot dataclass |
| rpi_tempmon/config.py | Config loading and validation |
| rpi_tempmon/display.py | Console output helpers |
| rpi_tempmon/alarms.py | Alarm evaluation and GPIO LED |
| rpi_tempmon/notifiers.py | Email and desktop notifications |
| rpi_tempmon/log_writer.py | File I/O, log rotation, CSV, report |
| rpi_tempmon/graphs.py | matplotlib graph modes (optional) |
| rpi_tempmon/stress_test.py | CPU stress test mode |
| $HOME/.config/rpi_tempmon/rpi_tempmon.cfg | Config file |
| $HOME/.cache/rpi_tempmon/ | Output folder for logs |
Config file
The config file is created automatically with default values on first run. It is split into three sections:
[ALARM]
ALARM_MODE = 0
CPU_UPPERLIMIT = 70

[MAIL]
RPI_AuthUser = example@gmail.com
MAIL_ALERT = 0
SMTP_SERVER = smtp.gmail.com
SMTP_PORT = 587
SMTP_PASSWORD =

[GPIO]
LED_MODE = 0
GPIO_LED = 26
ALARM_MODE — set to 1 to enable temperature alarms.
CPU_UPPERLIMIT — temperature threshold in Celsius (1–99). When exceeded in alarm mode, the display turns red, the GPIO LED activates, and an email is sent if mail alert is configured.
MAIL settings — set MAIL_ALERT to 1 and fill in your Gmail address and App Password. See Mail mode in Features section for setup instructions.
LED_MODE — set to 1 to enable GPIO LED output on alarm. Set GPIO_LED to the BCM pin number of your LED.
Log files are written to:
$HOME/.cache/rpi_tempmon/Log rotation is automatic — log.txt rotates at 1 MB keeping 5 backups (log.txt.1 through log.txt.5).
Python packages (installed automatically via pip):
| Package | Use |
|---|---|
| psutil >= 5.9 | CPU, RAM, and swap usage |
| gpiozero >= 2.0 | GPIO LED control |
| lgpio >= 0.2 | GPIO pin factory backend (Pi 4/5) |
| matplotlib >= 3.5 | Graph modes — optional extra [graphs] |
Depending on Environment and location installed, you may also need to install swig which is dependency of lgpio or install lgpio globally, lgpio homepage
sudo apt install swigSystem packages (optional, install only if needed):
# Desktop notifications (-n option)
sudo apt install libnotify-bin

# CPU stress test (-ST option)
sudo apt install sysbenchFor a Raspberry Pi the official operating temperature limit is 85°C. The Pi starts to thermally throttle performance around 82°C. GPU and CPU temperatures are closely correlated to within a degree.
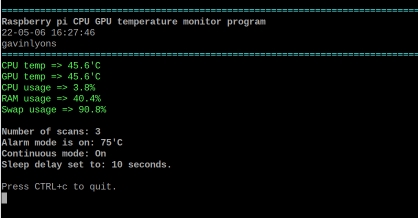
The program reads ARM CPU and GPU temperature and outputs them in Celsius together with a datetime stamp, CPU usage, RAM usage, and swap usage.
The program has ten modes:
- Normal mode — output to screen, optional GPIO output, prompt to repeat.
- Continuous mode — output to screen, optional GPIO output, updates on a timer.
- Logfile mode — append to single log.txt, optional mail alert on alarm.
- Logfolder mode — write to a new timestamped sub-folder each run.
- Mail mode — send log.txt to email via Gmail SMTP.
- Graph mode — plot log data as one of 12 graph types.
- CSV mode — convert log.txt to log.csv for use in other applications.
- Data mode — parse log file and print a statistical report.
- Notify mode — send a desktop notification.
- Stress test mode — stress the CPU and record temperature results.
1. Normal mode
Run with no arguments. Displays current readings and prompts to repeat or quit. Data is shown in red if the CPU temperature exceeds the configured alarm limit.
2. Continuous mode
Same as normal mode but runs on a timer. Pass the delay in seconds as argument:
rpi-tempmon -c 30Press CTRL+C to quit. GPIO LED is safely turned off on exit.
3. & 4. Log modes
Logfile mode appends one entry to log.txt each run. Designed for use with cron:
# Run once per hour
0 * * * * rpi-tempmon -l >/dev/null 2>&1
Sample log entry:
TS = 26-03-14 12:00:00
EP = 1741953600.0
GPU temperature = 52.0'C
CPU temperature = 52.3
Cpu usage = 18.4
RAM usage = 44.1
Swap usage = 12.0
Raspberry pi temperature monitor: raspberrypi
Log rotation is automatic at 1 MB. An alarm warning line is appended if the temperature limit is exceeded.
Logfolder mode creates a new timestamped sub-folder each run. Note: logfolder mode does not work with mail or graph mode.
5. Mail mode
Sends log.txt as an email attachment using Python's built-in smtplib. No system dependencies required.
Setup steps:
- Enable 2-Step Verification on your Google account at myaccount.google.com/security
- Generate a Gmail App Password at https://myaccount.google.com/apppasswords
- Add the 16-character App Password to SMTP_PASSWORD in the [MAIL] config section
- Set MAIL_ALERT = 1 and RPI_AuthUser to your Gmail address
- Set SMTP_SERVER = smtp.gmail.com and SMTP_PORT = 587
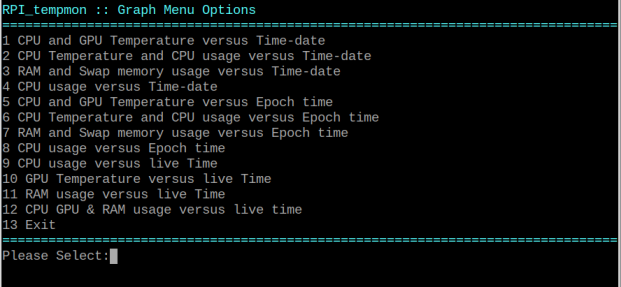
6. Graph mode
Requires the graphs optional extra:
pip install rpi-tempmon[graphs]Generates a menu of 12 plot types from log data or live readings:
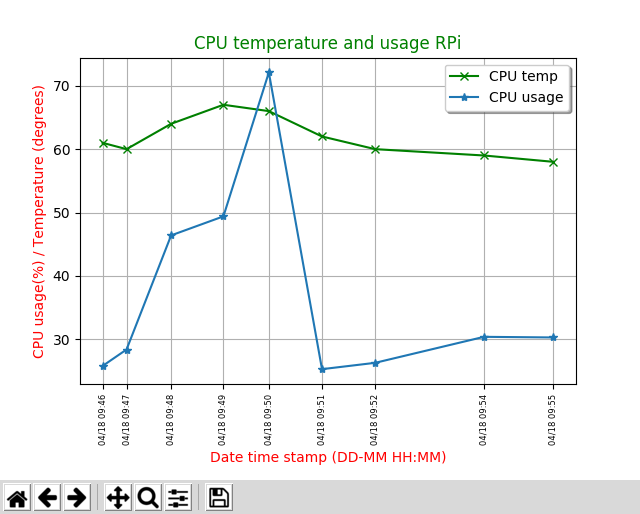
- Graphs 1–4: data versus date/time stamp
- Graphs 5–8: data versus Unix epoch (better for irregular cron intervals)
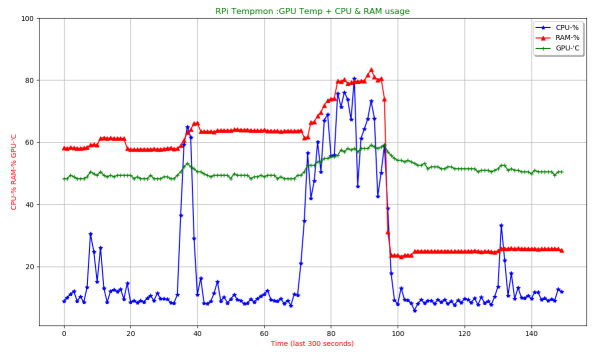
- Graphs 9–12: live data sampled every 2 seconds for 5 minutes
7. CSV mode
Converts log.txt to log.csv for use in spreadsheet applications.
Sample output columns: timestamp, CPU temp, GPU temp, CPU usage, RAM usage, swap usage
26-03-14 12:00:00,52.3,52.0,18.4,44.1,12.0
8. Data mode
Parses log.txt and prints a statistical report to the console showing average, min, and max for temperature, CPU usage, and RAM usage.
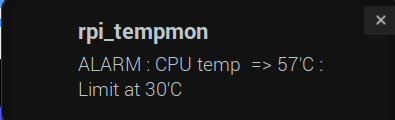
9. Notify mode
Sends a desktop notification via notify-send. Requires libnotify-bin.
sudo apt install libnotify-bin-n 2— always notify with current CPU temperature-n 3— notify only when CPU temperature exceeds the configured limit
10. Stress test mode
Stresses all CPU cores and records temperature and usage at each run. Results are saved to stresslog.csv and optionally displayed as a graph. Requires sysbench:
sudo apt install sysbenchPass the number of test runs as an argument (2–50):
rpi-tempmon -ST 10Sample CSV output — run number, CPU temp, CPU usage:
1,54.0,27.1
2,61.1,99.6
3,61.1,99.8