Validation plots
Default cuts:
selection = "flucDistR_entries>50 && zBinCenter<5"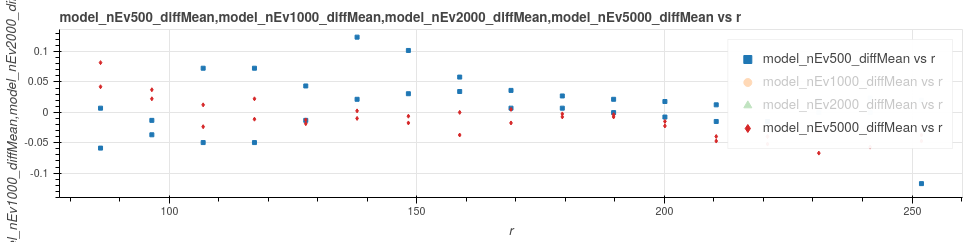
selectionSec = "z<5 & r<120"Comparison of models for mean 1.0, radius 117, deltaSC 0.5, all sectors


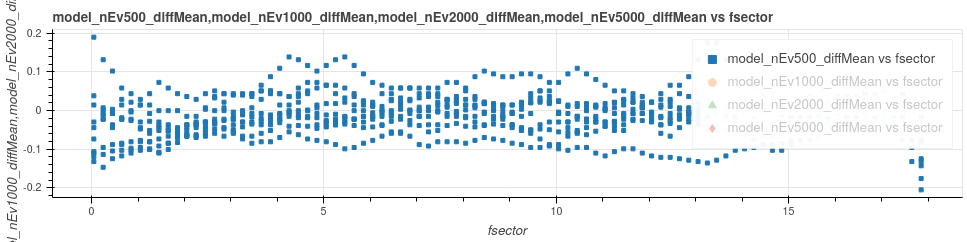
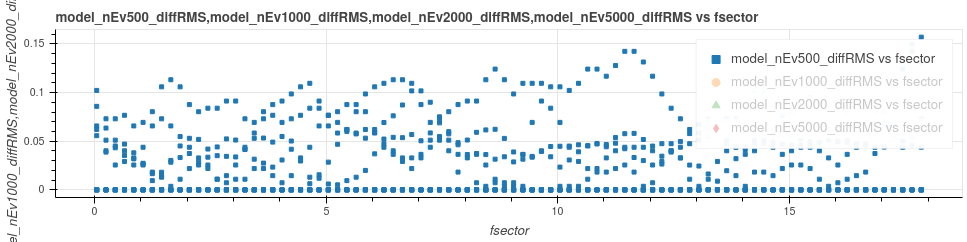
Results for model trained on 500 events, mean 1.0, radius 117, all deltaSC ranges
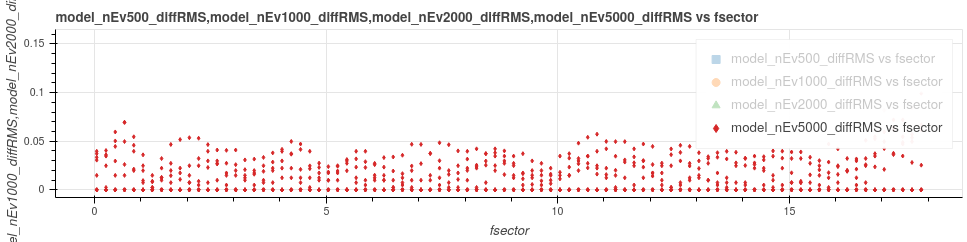
Results for model trained on 5000 events, mean 1.0, radius 117, all deltaSC ranges

Comparison of models for mean 1.0, fsector 9.85, deltaSC -0.02-0.02, all radii