-
Notifications
You must be signed in to change notification settings - Fork 22
Exploring Grafana WEB interface for CNSA project in a k8s OCP environment
The Grafana application host URL is stored in the grafana-route instance.
Example output:
oc get route -n $NAMESPACE
NAME HOST/PORT PATH SERVICES PORT TERMINATION WILDCARD
grafana-route grafana-route-grafana-for-cnsa.apps.hw.cp.fyre.ibm.com grafana-service 3000 edge None
In a browser put the 'HOST/PORT' URL to open a Grafana user interface. Click on ‘Sign In’ from the bottom left menu of Grafana, and log in using the default username and password configured earlier(root/secret).
Click on Configuration > Data Sources in the side menu and you’ll be taken to the data sources page where you can review and test grafana-bridge datasource settings.
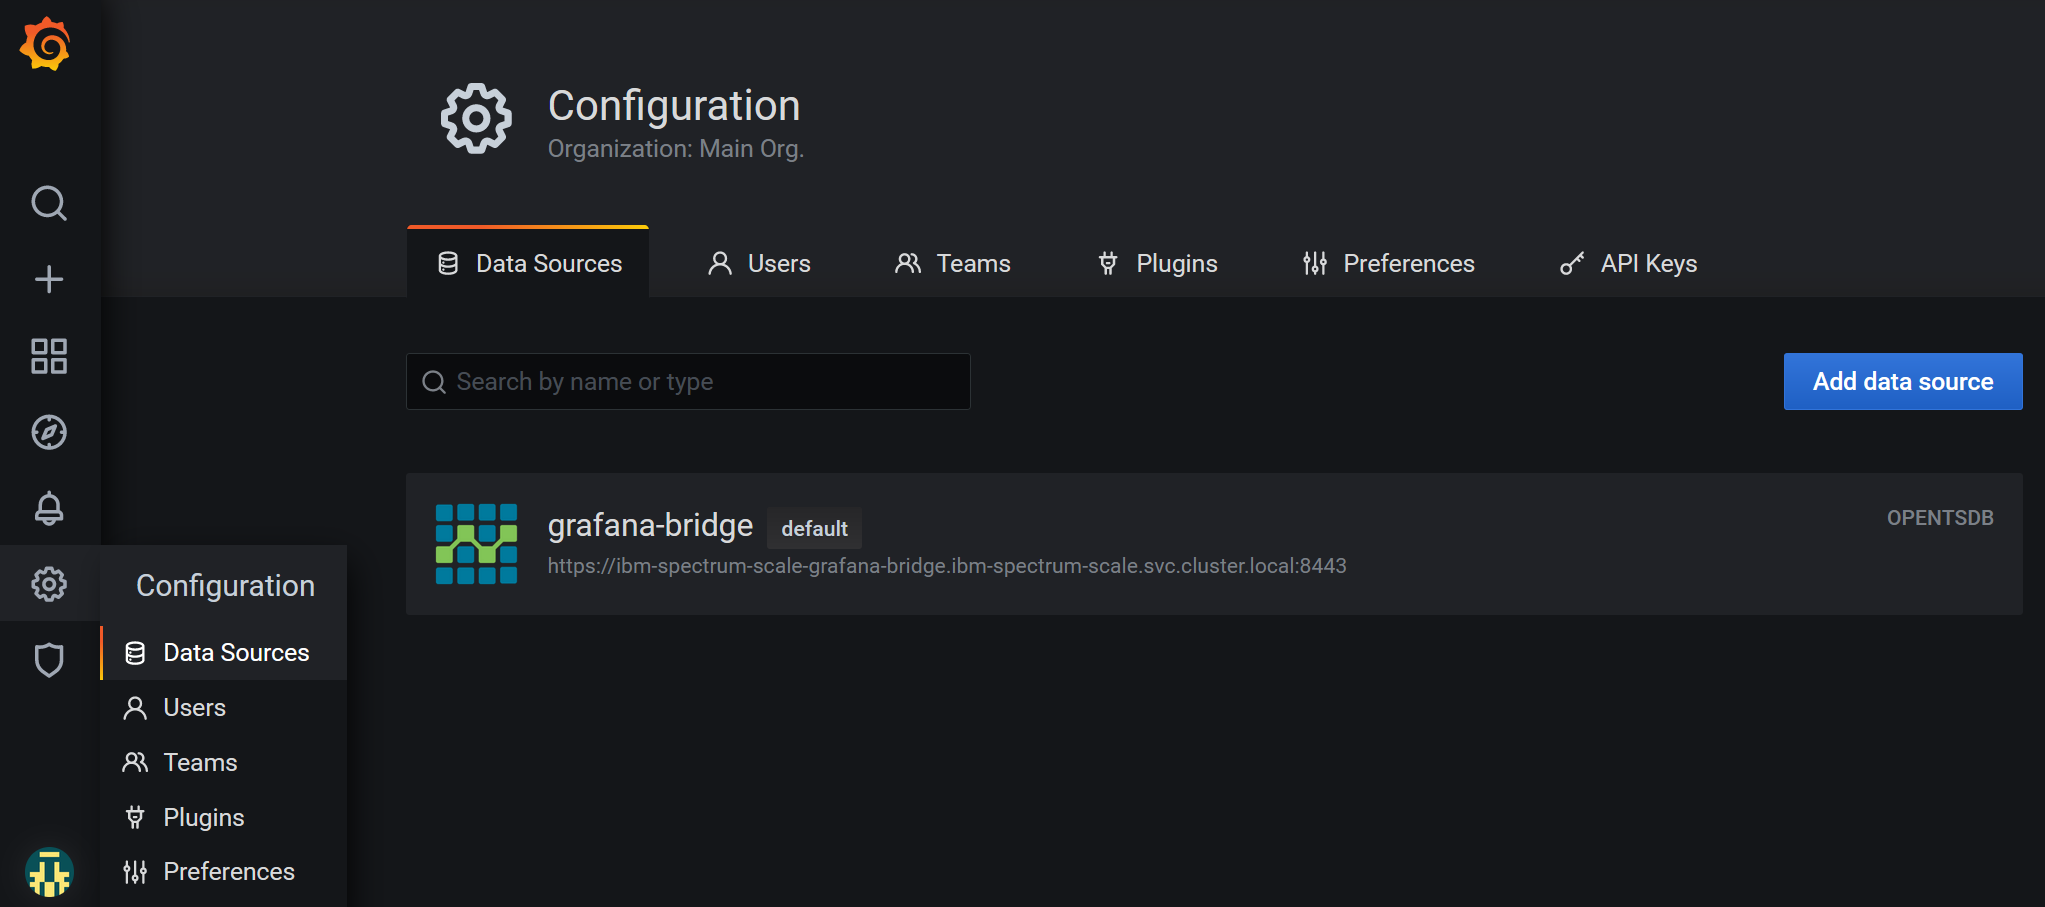
/images/Openshift/grafana_ui_datasource_settings.png
In the OpenTSDB settings make sure the version "2.3" is selected. Finally click on 'Save & Test' button.
Now you can import some predefined Grafana dashboards or create your own.
In the Grafana web interface sidebar, hover the cursor over Dashboards (squares) icon, and then click Manage. The simple dashboard is listed as member of the my-folder folder.
Click on the dashboard name (simple) to open this dashboard.
Visit the IBM Storage Scale Knowledge Center for getting more info about the latest product updates
-
- Setup classic Grafana
- Make usage of Grafana Provisioning feature
-
- Installing RedHat community-powered Grafana operator from OperatorHub
- Creating Grafana instance using the RedHat community-powered Grafana-operator
- Creating Grafana Datasorce instance from Custom Resource managed by the RedHat community powered Grafana operator
- Importing the predefined dashboard from the example dashboards collection
- Exploring Grafana WEB interface for CNSA project in a k8s OCP environment
- How to setup Grafana instance to monitor multiple IBM Storage Scale clusters running in a cloud or mixed environment
- API key authentication
- Configurable bridge settings
- CherryPy builtin HTTP server settings
- How to setup HTTPS(SSL) connection
- Start and stop grafana-bridge with systemd
- Refresh IBM Storage Scale cluster configuration data cached by grafana bridge
- Accelerate the PrometheusExporter data retrieval time
- Optimize the performance of PrometheusExporter by using scrape_job params settings
- Grafana Dashboard Panel shows no metric values for a particular entity
- Missing Grafana-Operator on an OpenShift cluster
- Missing CherryPy packages
- What to do if your system is on Python < 3.8
- Grafana-bridge fails to start with Python3.8
- Grafana-bridge container time is different from a host time
- Verify that the grafana-bridge returns data as expected