Setup Grafana
Download and install Grafana according to the given instructions. Before you start Grafana for the first time, check the configuration options for port settings. Start the Grafana server as it described on the Grafana configuration pages.
Define a new data source (Data Sources -> Add new data source)
Select the data source type (OpenTSDB or Prometheus) according to your IBM Storage Scale bridge for Grafana (grafana-bridge) configuration and usage.
Example of OpenTSDB Datasource settings
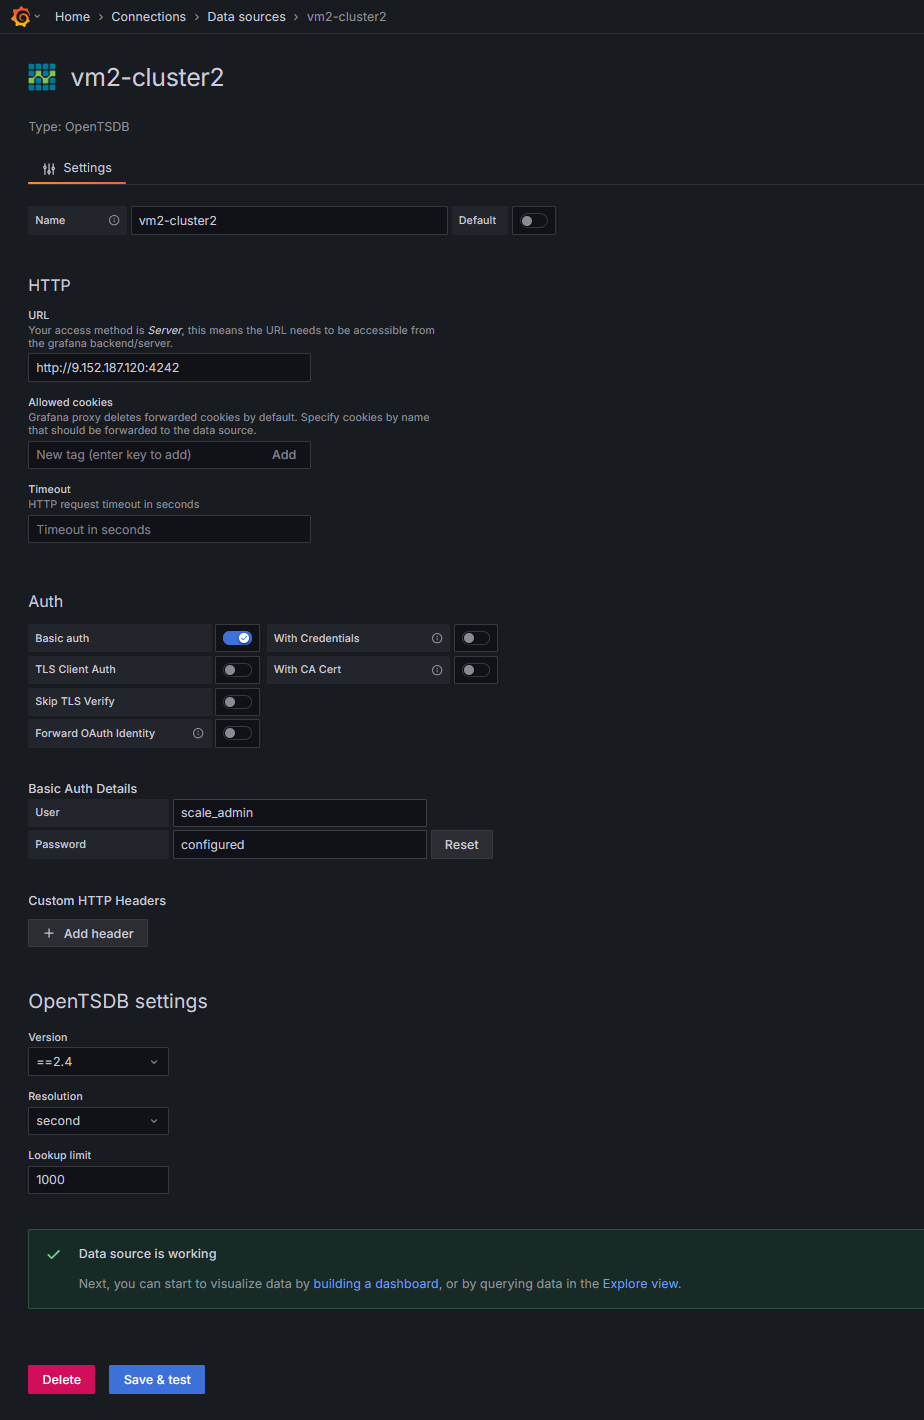
NOTE: The Basic Authentication password (Base64-encoded string) should be the same as the one you specified in the grafana-bridge config.ini file.
NOTE: Per default the IBM Storage Scale bridge listens on port 4242 for HTTP connections. For HTTPS(SSL) connections you need to set the appropriate protocol settings on the bridge start. Follow the instructions Generate SSL certificates to generate a private ssl key and a ssl certificate
Example of Prometheus Datasource settings

NOTE: You can secure communication between Grafana and the Prometheus server by configuring basic authentication or HTTPS/TLS. For more information, please refer to Prometheus server configuration and Grafana Prometheus Datasource documentation.
Grafana now can talk to Spectrum Scale Performance Monitoring tool via the bridge. Follow the grafana instructions to create dashboards.