Generate Prometheus config.yml flile content using grafana bridge
You must add an individual scrape job to the Prometheus configuration file (prometheus.yaml) for each IBM Storage Scale performance data acquisition sensor that you want to expose to Prometheus. Grafana-Bridge can pre-generate the contents of the configuration file in yaml format based on the available cluster configuration data. As a prerequisite, you must have installed the PyYAML Python packages on the host running the IBM Storage Scale bridge for Grafana before starting it.
Check if the PyYAML package is already installed.
# pip list | grep PyYAML
If not, install it and restart the grafana-bridge service.
# pip install PyYAML

# systemctl restart grafana-bridge
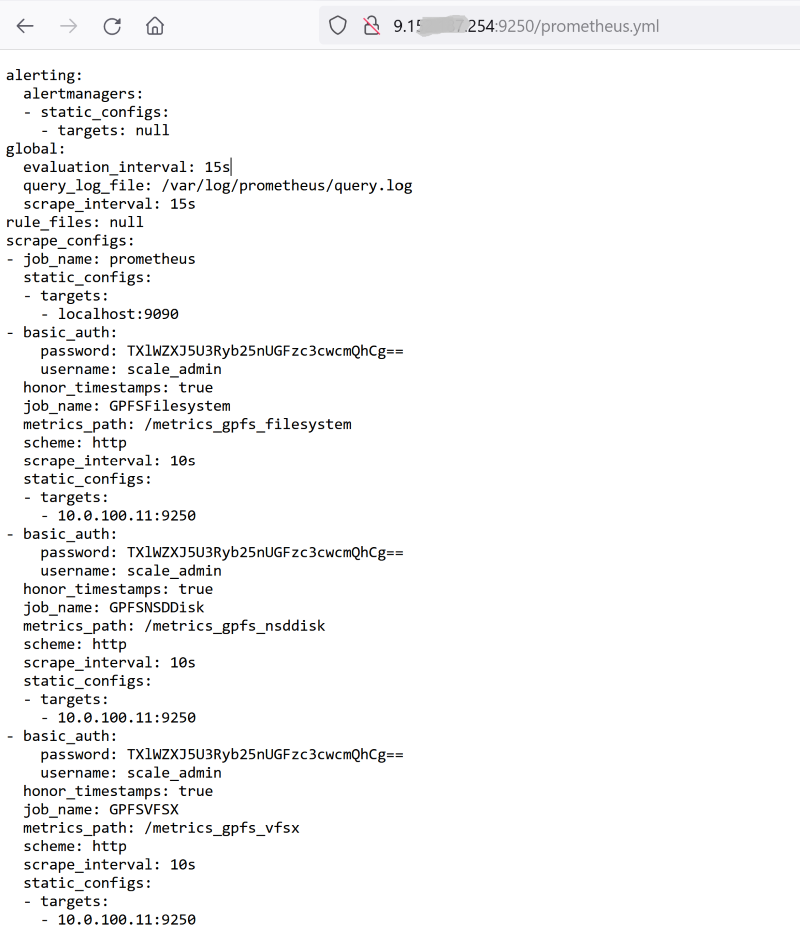
Enter the prometheus.yml endpoint in the address bar of a browser using the Prometheus Exporter plugin port
http(s)://<gafana-bridge-ip>:<prometheus-exporter-port>/prometheus.yml
You can also retrieve the content of the prometheus.yml via Curl REST API call
[root@scale-11 ~]# curl -v http://9.1XX.XXX.254:9250/prometheus.yml -u scale_admin:TXlWZXJ5U3Ryb25nUGFzc3cwcmQhCg==
*   Trying 9.1XX.XXX.254:9250...
* Connected to 9.1XX.XXX.254 (9.1XX.XXX.254) port 9250 (#0)
* Server auth using Basic with user 'scale_admin'
> GET /prometheus.yml HTTP/1.1
> Host: 9.1XX.XXX.254:9250
> Authorization: Basic c2NhbGVfYWRtaW46VFhsV1pYSjVVM1J5YjI1blVHRnpjM2N3Y21RaENnPT0=
> User-Agent: curl/7.76.1
> Accept: */*
>
* Mark bundle as not supporting multiuse
< HTTP/1.1 200 OK
< Content-Type: text/plain;charset=utf-8
< Server: CherryPy/18.9.0
< Date: Fri, 31 May 2024 10:55:13 GMT
< Allow: GET, HEAD, OPTIONS, TOPO
< Content-Length: 5317
<
alerting:
  alertmanagers:
  - static_configs:
    - targets: null
global:
  evaluation_interval: 15s
  query_log_file: /var/log/prometheus/query.log
  scrape_interval: 15s
rule_files: null
scrape_configs:
- job_name: prometheus
  static_configs:
  - targets:
    - localhost:9090
- basic_auth:
    password: TXlWZXJ5U3Ryb25nUGFzc3cwcmQhCg==
    username: scale_admin
  honor_timestamps: true
  job_name: GPFSFilesystem
  metrics_path: /metrics_gpfs_filesystem
  scheme: http
  scrape_interval: 10s
  static_configs:
  - targets:
    - 10.0.100.11:9250
- basic_auth:
    password: TXlWZXJ5U3Ryb25nUGFzc3cwcmQhCg==
    username: scale_admin
  honor_timestamps: true
  job_name: GPFSNSDDisk
  metrics_path: /metrics_gpfs_nsddisk
  scheme: http
  scrape_interval: 10s
  static_configs:
  - targets:
    - 10.0.100.11:9250
- basic_auth:
    password: TXlWZXJ5U3Ryb25nUGFzc3cwcmQhCg==
    username: scale_admin
  honor_timestamps: true
  job_name: GPFSVFSX
  metrics_path: /metrics_gpfs_vfsx
  scheme: http
  scrape_interval: 10s
  static_configs:
  - targets:
    - 10.0.100.11:9250
...