MRI_Count_Spot_Populations_Tool
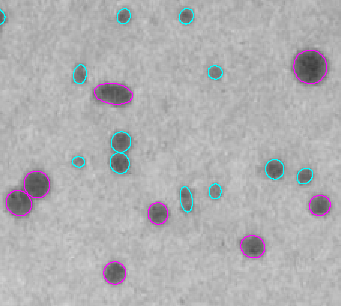
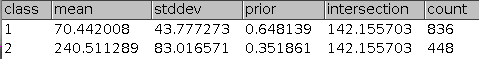
The tool detects and and counts the spots (or blobs) in an image. It has been created for the counting of bacteria colonies in in Petri-dishes. It separates the spots into two populations and counts each population individually. The populations are separated by the area of the spots. The tool uses expectation maximisation clustering from the weka software.

|
|

|
|
To install the tool save the files Count_Spot_Populations_Tool.ijm and results_table-clusterer.py into the folder macros/toolsets of your FIJI installation.
Select the "3D_nuclei_clustering" toolset from the >> button of the ImageJ launcher.
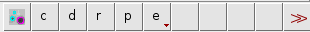
- the first button opens this help page
- the c-button starts counting and clustering of the spots on the active image
- the d-button runs a DoG-filter on the active image
- the r-button runs the clustering by area on a results table
- the p-button plots a histogram and the distributions of the spot areas
- the e-button opens an extras menu, from which example images can be downloaded
Open an input image. The tool will detect dark spots on a bright background. If necessary invert the contrast of the image (Edit>Invert) before running the tool. Set the options for the detection of the Petri-dish and the spots (see below). Make sure that Area is selected in Analyze>Set Measurements.... Press the c-button to run the analysis.
The clustering can also be run on a results table, using the r-button. The results table must contain the column Area. The plotting of the area-histogram and distributions with the p-button is also possible in this case.
Right-click on the c-button to open the options dialog.
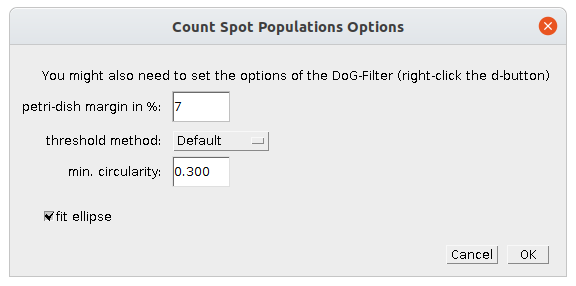
- Petri-dish margin
- Allows to exclude a smaller or bigger part that coresponds to the border of the Petri-dish.
- threshold method
- The auto-thresholding method used for the spot-segmentation.
- min. circularity
- Allows to filter spots by their circularity.
- fit ellipse
- If selected an ellipse will be fit to each segmented spots.
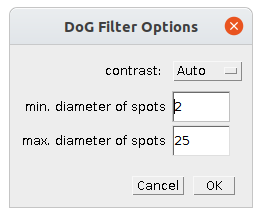
- contrast
- Select the contrast of the image: auto, normal or inverted.
- min. diameter of spots
- The minimum diameter of the spots
- max. diameter of spots
- The maximum diameter of the spots

- color cluster one
- the color in which the distribution of the smaller areas is displayed
- color cluster two
- the color in which the distribution of the bigger areas is displayed
- color histogram
- the color in which the histogram of the areas is displayed
- histogram bin width
- the bin width of the area-histogram
- distribution line width
- the line width for the distributions in the plot
 Volker Bäcker