MRI_Dynamic_Zones_Analyzer
Find and segment zones in which the intensity changes over time. Classify the zones into zones with increasing, decreasing, constant, u-shaped and n-shapes intensity profiles.
If you want to align the frames, you must have stackreg installed. You also need to have morpholibj (IJPB-plugins) installed.
To install the tool save the file analyze_dynamic_zones.ijm into the folder macros/toolsets of your FIJI installation.
Select the "analyze_dynamic_zones" toolset from the >> button of the ImageJ launcher.

- the first button opens this help-page
- the
a-button runs the analysis on the current image - the
t-button displays a plot of the total intensity over time for a selected region (select the ROI in the image before pressing the button) - the
p-button displays a plot of the area over time for a selected region (select the ROI in the image before pressing the button) - the
m-button displays a plot of the mean intensity over time for a selected region (select the ROI in the image before pressing the button)
Open a 2D-time-lapse image, adapt the parameters to your needs (right-click on the a-button) and press the a-button. Zones of activity (non constant signal over time) will be segmented and the corresponding labels will be overlaid over the image. Each zone will be labeled increasing, decreasing, constant, n or u. To be considered non-constant the activity must surpass a user selected threshold-value. You can plot the total-intensity, the area and the mean-intensity for a selected zone (click on the label in the image or on the row in the roi-manager) over time.

- Dynamic
- Choose whether to use the total intensity, the area or the mean intensity classify the zones
- Dynamic threshold
- The activity must be above the threshold to be considered non-constant
- Radius of background filter
- The radius of the filter that will be used to remove the background. It should be large enough to make the objects of interest mostly disappear.
- Gradient filter xy-radius
- The radius in x and y of the gradient filter. We are interested in the changes in time so the value for xy should be small
- Gradient filter z-radius
- The radius in z (really t) of the gradient filter.
- Border size
- The pixels up to the given distance from the border will be set to zero, to remove objects on the border of the image that would hinder the segmentation.
- Align frames
- If selected the frames will be aligned with respect to rigid-body transformations, using stack-reg.
- Show constant zones
- If selected ROIs will also be created for constant zones, otherwise only for zones with some activity
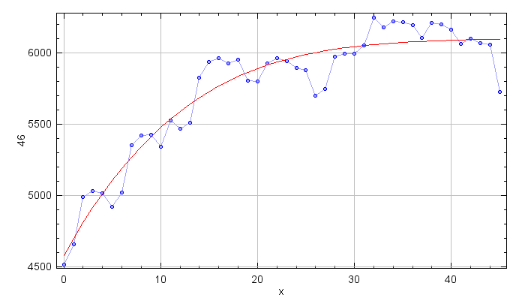
A blurred version of the image is subtracted from the input image to remove background. The z- and t-axes are swapped and a 3D morphological gradient filter is applied. The result is binarized using the Otsu-autothreshold (based on the stack histogram) and a connected component labeling is run after Fill holes has been applied and the border pixels have been removed. For each Label the t-profile for the mean intensity, the area and the total intensity are written to a table. The Error Function is fit to each plot. The values at the first frame, the last frame and a maximum or minimum between the two are compared to classify the zone.
-
Legland, D., Arganda-Carreras, I., & Andrey, P. (2016). MorphoLibJ: integrated library and plugins for mathematical morphology with ImageJ. Bioinformatics, btw413. doi:10.1093/bioinformatics/btw413
-
P. Thévenaz, U.E. Ruttimann, M. Unser, "A Pyramid Approach to Subpixel Registration Based on Intensity," IEEE Transactions on Image Processing, vol. 7, no. 1, pp. 27-41, January 1998. Other relevant on-line publications are available at http://bigwww.epfl.ch/publications/.
 Volker Bäcker