Introduction
Machine learning is about extracting knowledge from data. It is a research field at the intersection of statistics, artificial intelligence, and computer science. By using related pieces of information, a machine learning algorithm is capable of finding the influences these pieces of information have on a particular classification. A good example of this is a spam filter which determines whether an email item is spam based on characteristics of the email such as the sender, content, number of recipients and subject header.
There are two types of machine learning algorithms:
This algorithm uses pre-known results to help teach and help classify new data it receives. These algorithms are easier to create but it can be difficult to classify some data before using this algorithm.
These algorithms are only provided with input data. This is often used when the classification of certain data is not known. For example classifying different customers into groups of similar preferences could have a multitude of different groups that can't be classified beforehand.
For each of these algorithms it is important to have a representation of your input data that a computer can understand. It is best to consider your data like a table. Each data point that you want to reason about is a row and each property that describes that data point is a column.
| Name | Weight | Height | |
|---|---|---|---|
| Data Point #1 | John Doe | 75kg | 130cm |
| Data Point #2 | Mary Jane | 65kg | 160cm |
Example of table structure for data points and features
An understanding of the problem space and the data you are working with is key. It is important that the dates that you are collecting is of a format that will help you solve the problem you are trying to solve.
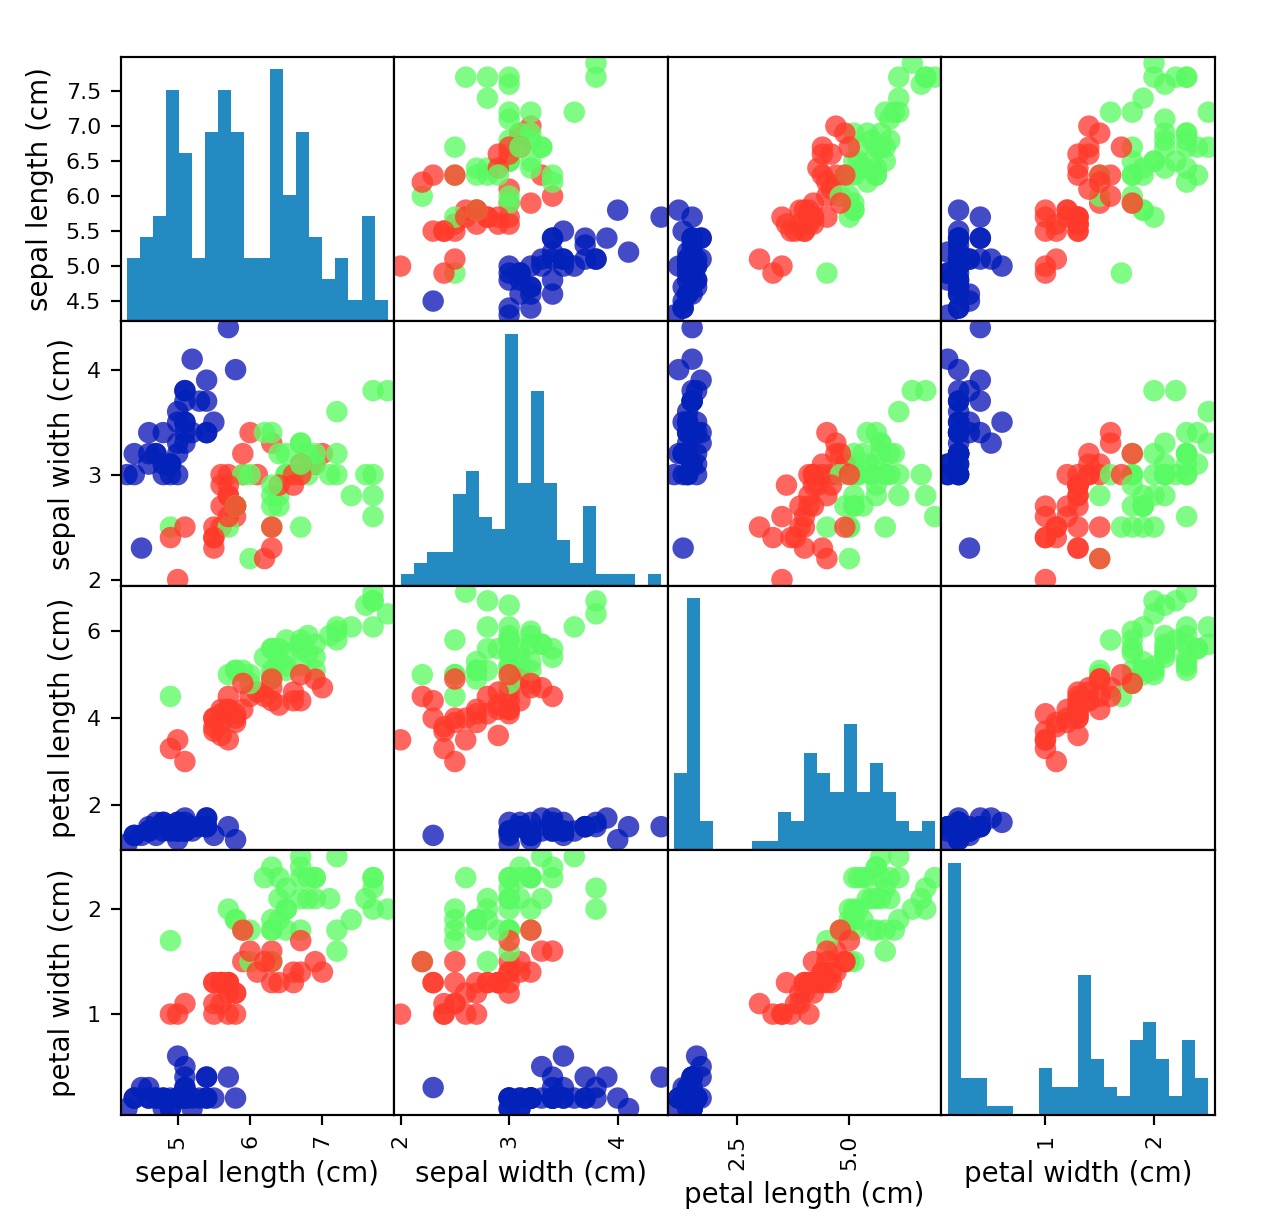
This image shows a graph of the petal data. This data is well separated and the algorithm should be able to use our features to identify the data points
In this exercise we will be using various information about the iris of a flower to determine its species. The data that we are using is retrieved from the scikit-learn datasets module.
The data contains the following features: Features:
- Sepal Length
- Sepal Width
- Petal Length
- Petal Width
By using the numpy shape function on the dataset we will be ablle to see the number of features and samples in our dataset
print("Shape of data: {}").format(iris_dataset['data'].shape)
Shape of data: (150, 4)
Our data is composed of 150 data points and 4 features
Ideally our algorithm will be able to protect the species of Iris for a particular measurement with 100% accuracy. However no algorithm is perfect and we need to ensure that our data actually gives us predictions with a reasonable accuracy.
We cannot use the data we used to build the model to evaluate it. This is because our model can just remember the whole training set and therefore always predict the correct result (If I know how tall a particular building is and you ask me how tall it is I won't be predicting the result). This leads to a misleading prediction accuracy and does not inform us whether it will perform well with new data (it will not generalise well).
To solve this problem we split our data into two sets the first part the training data/set and the rest the testing set which we use to test how well our algorithm predicts with new data.
X_train, X_test, y_train, y_test = train_test_split(iris_dataset['data'], iris_dataset['target'], random_state=0)